Policy Incidents Summary
The Policy Incidents Summary page provides a unified summary to view information on all DLP and Security Configuration Audit policy incidents. This allows you to review the effectiveness of individual policies and fine-tune evaluation accuracy for DLP and Configuration Audit policies against the number of incidents generated and remediation actions.
You can display Policy Incidents data in a Table view, or create a Chart view. It also provides easy access to filters, Saved Views, and allows you to schedule a report, and display policy details with a single click.
To view the page, go to Incidents > Policy Incidents Summary.
Data Retention Update
The Skyhigh CASB default data retention period has changed from 90 days to 100 days. Beginning with Skyhigh CASB 5.0.2, the data retention policy (100 days or 12 months, if you purchased the 12-month data retention plan) is applied for the incidents displayed on the Policy Incidents summary and page. As a result, you may see fewer incidents displayed on the Policy Incidents pages compared to previous versions. Policy Incident retention policy is applied using the incident modified date.
Table View
The Policy Incidents Summary page Table view is the default view.

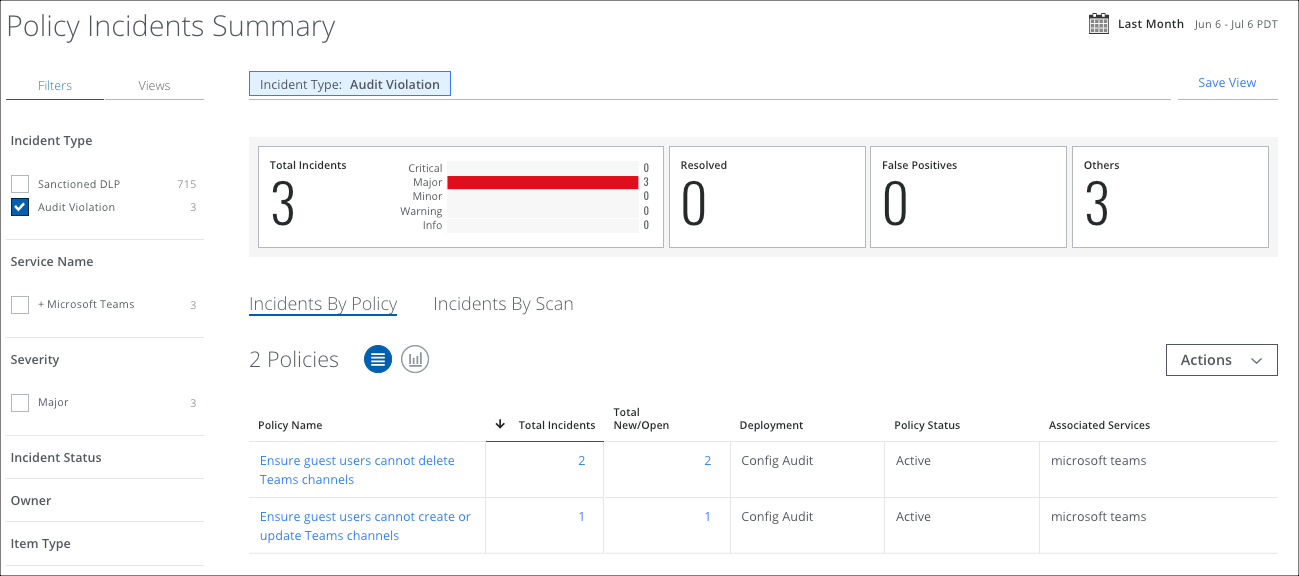
The Policy Incidents Summary page provides the following information and actions:
- Filters. Select options on the Filters tab to scope down your search.
- Views. Select the Views tab to use Saved Views created by you or shared with you by another user to reuse specified search parameters from a previous search on current data.
- Search. Search via the Omnibar. You can search for multiple incident IDs by entering a comma-separated query in the Omnibar. Additionally, you can use NOT operators to exclude specific terms from your search results. For details, see NOT Operator.
- Date Picker. Use the Date Picker to select a preset or custom date range in order to display data from only this date range.
- Save View. Click to create a Saved View from your search query.
- Total Incidents Generated. Displays a single numerical value for the total number of incidents generated per the filter criteria. The color indicates the level of the incident, either Critical, Major, Minor, Warning, or Info.
- Unresolved. Displays the number of Unresolved incidents.
- Resolved. Displays the number of Resolved incidents.
- False Positives. Displays the number of False Positive incidents.
- Incidents by Policy. This tab displays details about Incidents by Policy in the main table.
- Incidents by Scan. This tab displays details about Incidents by Scan (on-demand scan) in the main table.
- Actions.
- Download CSV. Click to download the data in the table as a CSV XLSX file.
NOTE: The columns in the CSV file reflect the columns in the table as displayed. - Create Report
- Business Report (PDF). Create a PDF report and run it immediately, which then appears in the Report Manager.
- CSV. Create a CSV report and run it immediately, which then appears in the Report Manager.
- XLS. Create an XLS report and run it immediately, which then appears in the Report Manager.
- Schedule. Schedule a report to run at a later time, which then appears in the Report Manager.
- Settings
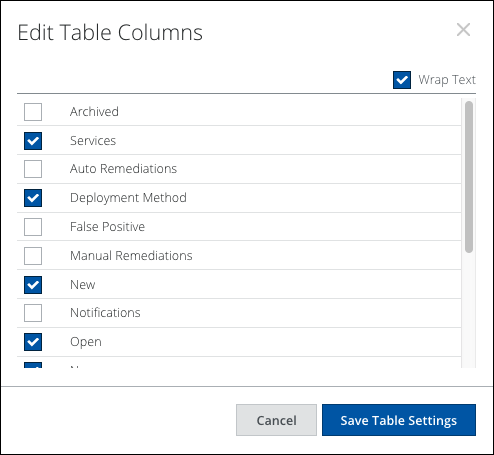
- Edit Table Columns. When complete, click Save Table Settings.
- Download CSV. Click to download the data in the table as a CSV XLSX file.
Policy Incident Columns
You can configure the columns in the Policy Incident Summary page to make sure you're seeing the data that is most important to you. The following table columns are available:
NOTE: The maximum limit for the archived incident in the dashboard is 100,000.
- Archived. The number of archived incidents.
- Services. Displays the names of the cloud service providers that the policy is enforced against.
- Auto Remediations. The count of automated response actions that were executed when creating the incident. This may not be equal to the total number of incidents. If a policy is explicitly configured to have multiple response actions (like Delete and User Email Notification), both response actions are counted as automated remediations. (For policies configured to have a single response, this count is equal to the total number of incidents.)
- Deployment Method. Displays the type of deployment (API, Config Audit, or Proxy) of the CSP that was in use when the policy was triggered.
- False Positives. The number of incidents that are false positives.
- Manual Remediations. The count of manual remediation actions performed for all the incidents associated with the policy.
- New. The number of new incidents.
- Notifications. The number of notifications sent for the incident.
- Open. Total number of Open (or unresolved) incidents.
- Name. Name of the policy.
- Status. Shows if a policy is Active (turned on) or Disabled (turned off).
- Resolved. Count of all resolved incidents for the policy.
- Suppressed. The number of suppressed incidents.
- Total Incidents. The total number of incidents triggered (created) by the policy.
- Total Unresolved. The total number of unresolved incidents.
- Users. Total count of unique users who violated the policy.
If you download a report from this page, all visible columns are included.
Edit Table Columns
To edit table columns:
- Click Actions, then choose Edit Table Columns.
- Select or deselect the columns.
- Once you're happy with the options you've selected, click Save Table Settings.

In the Table, you can click the policy name to go to the Policy Incidents page to edit the policy. You can also click other available hyperlinks to drill down into those details.
Column Width Persistence
On the Policy Incidents Summary and Policy Incidents pages, in the table view, you can change the column width, and when you log out and log in again, your changes will persist.

Policy Violation to Sanctioned DLP
On the Policy Incidents Summary and Policy Incidents page, the Incident Type filter label and Omnibar value Policy Violation is changed to Sanctioned DLP. For reports, the CSV and XLXS reports are not affected, however, PDF reports will reflect the new string name as PDF reports capture the screen as displayed.
Chart View
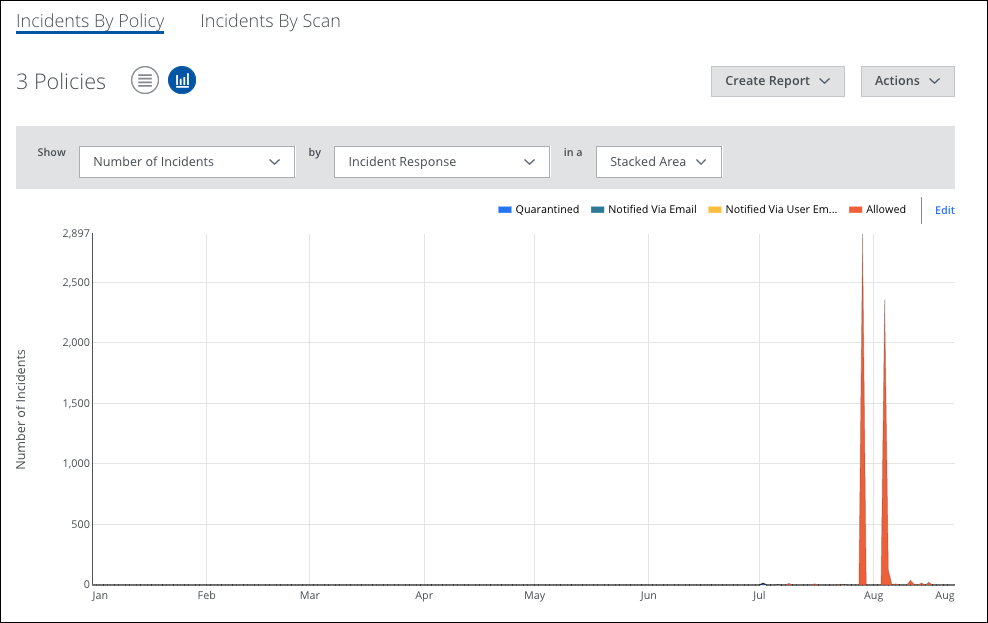
To display your Policy Incidents data in a chart, click the Chart icon, under the Omnibar.

To display Policy Incidents data in a chart:
- Select an item from the Show list to determine the X-axis of your chart.
- Select an item from the By list to determine the Y-axis of your chart.
- To edit your chart's Dimension By data, click Edit.
- In the Dimension By dialog, Select Top 10 items or Custom to select up to 10 items from the list. Then click Done.

- In a list, select the type of chart available: Stacked Area, Line, or Donut.
- Your data is displayed in the chart.
To edit your chart's Dimension By data, click Edit.
