About Activities
| Limited Availability: To access the Historical User Risk Type Filter, and Event Target ID features, contact Skyhigh Support. |
The Activities page provides details on the user activities captured within your organization. It can be used to monitor the activity of how users within your organization use cloud services over time.
Find the page at Incidents > User Activity > Activities.
Previously, all data on the Activities page was loaded immediately. This caused the page to load slowly. Now, only the Service Name filter is expanded by default. All other filters are developed on demand to improve page performance.
Notes
The current version of the Activities page has the following important changes from the previous version:
- To see the Activities page, you must have the Activities role assigned to your Skyhigh CASB account.
- To see the Activity Timeline, use the Chart View on the Activities page or the Chart View on the Anomalies page.
- For information previously viewed in the Anomalies tab, see About Anomalies.
- Instead of viewing a list of users on the Users tab, search for users using the User Name filter, and on the Anomalies and Threats pages.
- The Geo Location View is available along with Table View and Chart View icons.
- To create anomaly exceptions, use the Anomalies page
- The Activities page now features Chart View, Saved Views, and Scheduled Reporting, providing consistency with most other Skyhigh CASB page features and layouts.
- The Collaboration graph tab, previously shown for some SaaS services, is no longer available.
- The Edit Categories option to assign individual activities to one of the pre-defined categories is not available.
- Any existing Saved Views are migrated from the old page, except for Saved Views created with regex, which are not supported.
Table View

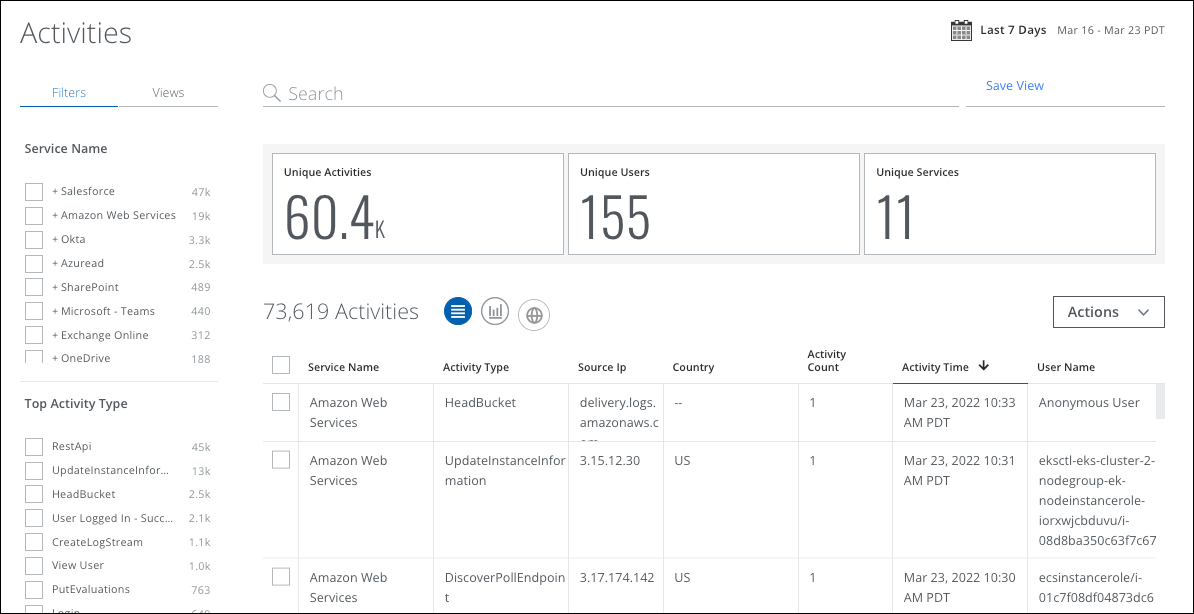
The Activities page provides the following information and actions:
- Filters. Select options on the Filters tab to scope down your search.
- Views. Select the Views tab to use Saved Views created by you or shared with you by another user to reuse specified search parameters from a previous search on the current data.
- Search. Search via the Omnibar. You can search for multiple incident IDs and multiple users by entering a query in the Omnibar. Regex-based search and wildcards are supported for partial user names, agents, and file names. (For example, user*, and *.pdf.)
- Date Picker. Use the Date Picker to select a preset or custom date range to display data from only this date range. This honors the data retention as applicable for the tenant
- Save View. Click to create a Saved View from your search query.
- Executive Summary. The Executive Summary displays an at-a-glance view of the current activities count along with users and services.
- Activities. The total number of user activities for all services.
- Unique Users. The total number of unique users for all services.
- Unique Services. The total number of unique services.
- Actions.
- Settings
- Edit Table Columns. When complete, click Save Table Settings.
- Download CSV. Click to download the data in the table as a CSV XLSX file.
- Settings
NOTE: The columns in the CSV file reflect the columns in the table as displayed. To download the data from more columns, select and add those to the view using Actions > Edit Table Columns.
- Create Report
- Business Report (PDF). Create a PDF report and run it immediately, which then appears in the Report Manager.
- CSV. Create a CSV report and run it immediately, which then appears in the Report Manager.
- XLS. Create an XLS report and run it immediately, which then appears in the Report Manager.
- Schedule. Schedule a report to run later, which then appears in the Report Manager.
- User Risk Report. Generate and download a User Risk Report to identify high, medium, and low-risk users for sanctioned services in your organization. You can generate or schedule a report, and access the generated reports via email or in the Report Manager.
NOTES:
- The User Risk Report includes data from the last 100 days.
- You cannot view the Filters configured for the User Risk Report on the Schedule Report page.
Generate User Risk Report includes the following options:
- Generate Report. Click to generate a report. By default, the report is generated in the CSV file format. The report's title includes the report's name, current date, and time. For example, User Risk Report 10_09_23 1_56_50 PM UTC.
- Select your report format. Select CSV or XLSX file formats to generate a report.
- Schedule. (Optional) Schedule a report to run later, which then appears in the Report Manager.
An email is sent to the recipients with a link to download the report from Report Manager, and the report is attached if the size is less than 25 MB. The report includes user details such as username, user email, user risk score, number of incidents, threats, anomalies, activities, Active Directory (AD) attributes, and more.
- Service Name. Displays the name of the cloud service for the user activity.
- Activity Type. Displays the type of user activity.
- Source IP. Displays the source IP address of the user activity.
- Country. Displays the country of origin of the user activity.
- Activity Count. Displays the number of user activities.
- Activity Time. Displays the time at which the user activity occurred.
- User Name. Displays the User Name of the user who performed the activity.
- User UID. Unique identification number of a user in your organization.
- Event Target ID (applicable only to OneDrive and SharePoint activities). This column displays the entity on which the action is performed, depending on the activity type. For example, if a file is shared with a user, this column shows the recipient's name, not the name of the user who shared the file. Similarly, if the action involves a group, the column displays a link to the group. The Event Target ID value is defined by OneDrive and SharePoint, depending on the specific activity type. To add this column to the table, go to Actions > Edit Table Columns, and select the Event Target ID checkbox.
- ► Click to view Event Target ID
- You can view the Event Target ID column on the Activities table and the Activities Cloud Card.


Track User Activities Using User UID
The Activities page features a User Unique Identification (UID) column, enabling improved tracking and analysis of user activities within your organization. The User UID is a unique identification number assigned to each user. Since a single user may log in with multiple accounts or email addresses, the activities are recorded in different entries in the Activities table. The User UID consolidates all activities under one identifier across Sanctioned, Shadow/Web, and Private applications, enabling SOC analysts to view a complete activity trail. This consolidation allows security teams to correlate events across different systems, reduce duplication in investigations, and respond to suspicious activity with greater speed and precision.
NOTE: You can track anomalies and threats using User UID.
Filter Activities by User UID
On the Activities page, You can filter all activities related to a specific User UID using the Omnibar search and the Activities Cloud Card, and the results are displayed in the Activities table:
- Filter activities by User UID using the Omnibar search
- Filter activities by User UID using the Cloud Card
Filter Activities by User UID Using the Omnibar Search
On the Activities page, you can search and view the User UIDs to know the activities linked to a specific user:
- Search for User UIDs. In the Omnibar, enter the User Unique Identification (UID) number to search for specific User UIDs.
- View the User UIDs in the Activities table. You can view the User UIDs from your search in the User UID column of the Activities table. To add the User UID column to the Activities table, see Edit Table Column.
NOTE: If the User UID is not available, search by the User Name instead. The associated User UID appears in the User UID column. Copy the User UID and enter it in the Omnibar search to view all related activities. You can search multiple User UIDs or names in the Omnibar at once.

Filter Activities by User UID Using the Cloud Card
Use the Activities Cloud Card to filter activities by User UID.
To filter activities specific to the User UID, perform the following steps:
- On the Activities page, click any activity in the Activities table to open its Cloud Card.

- In the Cloud Card, click the filter next to User UID. All activities associated with the selected User UID appear in the Activities table.


Generate User UID Reports
Go to Actions > Create Report to generate reports that list all activities of the selected User UID. For information on creating reports in various formats, see Create a Report.

Historical User Risk Type Filter
From the list of activities, you can filter and categorize your search by Historical User Risk Type for low, medium, and high-risk users.
Historical User Risk Score is a risk score assigned to the user whenever the activity is created, and it is rated on a scale of 1–9. This score is measured based on various factors such as the severity of the violation, the user’s security posture, and metadata about the user's overall compliance history. The score identifies the deviations as high, medium, and low-risk types:
- High (7-9). This score indicates a great potential for cloud services and data to become vulnerable to threats. This level is the least trustworthy.
- Medium (4-6). This score indicates a moderate potential for cloud services and data to become vulnerable to threats.
- Low (1-3). This score indicates little potential for cloud services and data to become vulnerable to threats. This level is the most trustworthy.
The Historical User Risk Score allows you to track and manage users’ typical usage patterns related to data security and take necessary actions to strengthen the defense against potential threats in your organization.
To filter your Historical User Risk Type for activities:
- On the Activities page, select any service, and then select Low (1-3) on the Historical User Risk Type filter. The Activities table displays only the low-risk users of the selected service.

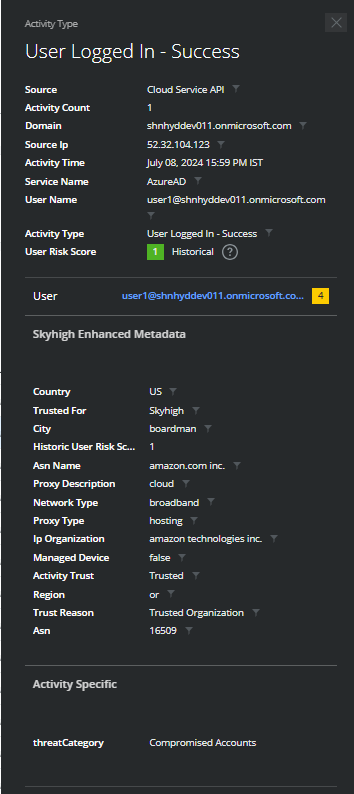
- Click any activity on the table to open the Cloud Card and view the Historical User Risk Score of the user and the activity details.
Activities Cloud Card
Click a row in the Activities table view to display the Activities Cloud Card, which provides a detailed view of the selected activity. From here, you can use filters to search for more information about the selected activity, view Enhanced Metadata, and view Activity-Specific details.

Chart View
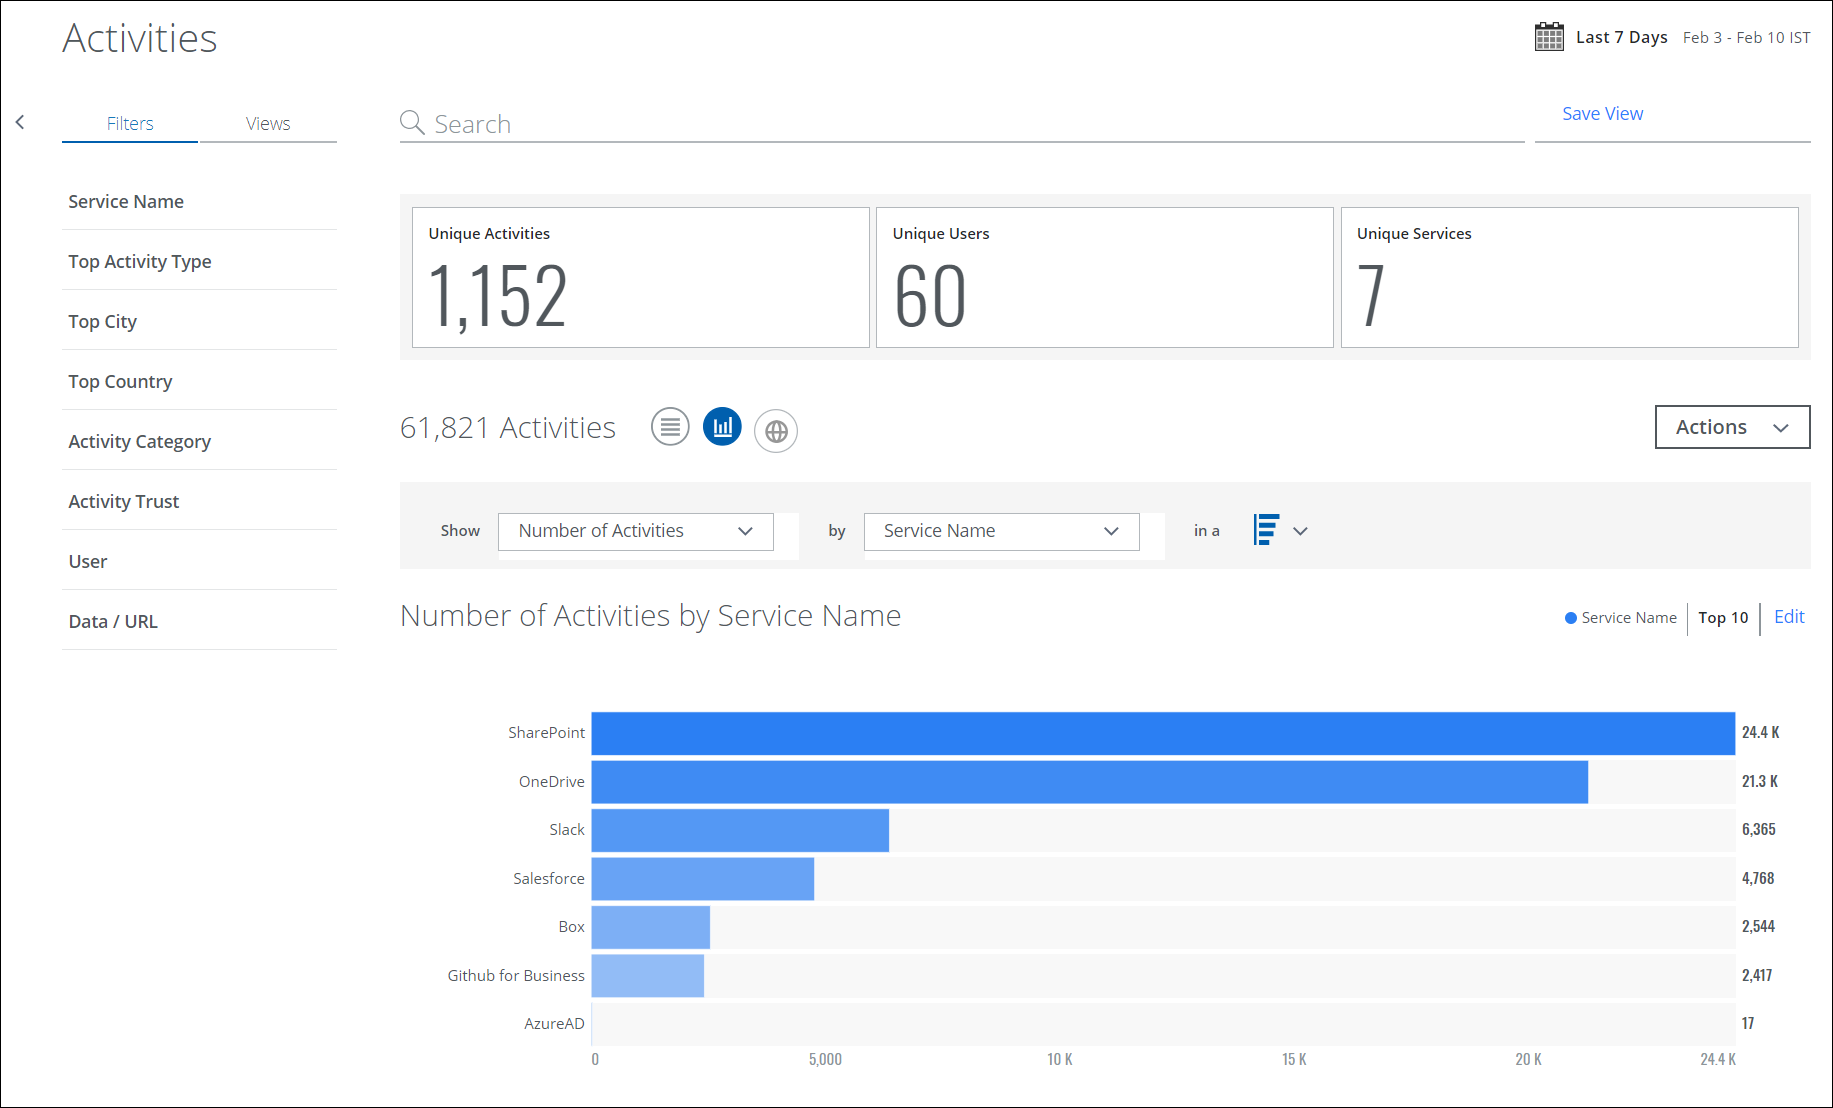
To display your Activities data in a chart, click the Chart icon under the Omnibar.

To display Activities data in a chart:
- Show. Select an item from the Show list to determine the X axis of your chart.
- By. Select an item from the By list to determine the Y axis of your chart.
- In a. From In a list, select your chart type, if available:
- Breakdown. Donut or horizontal bar chart.
Your data is displayed in the chart.
Geo Location View
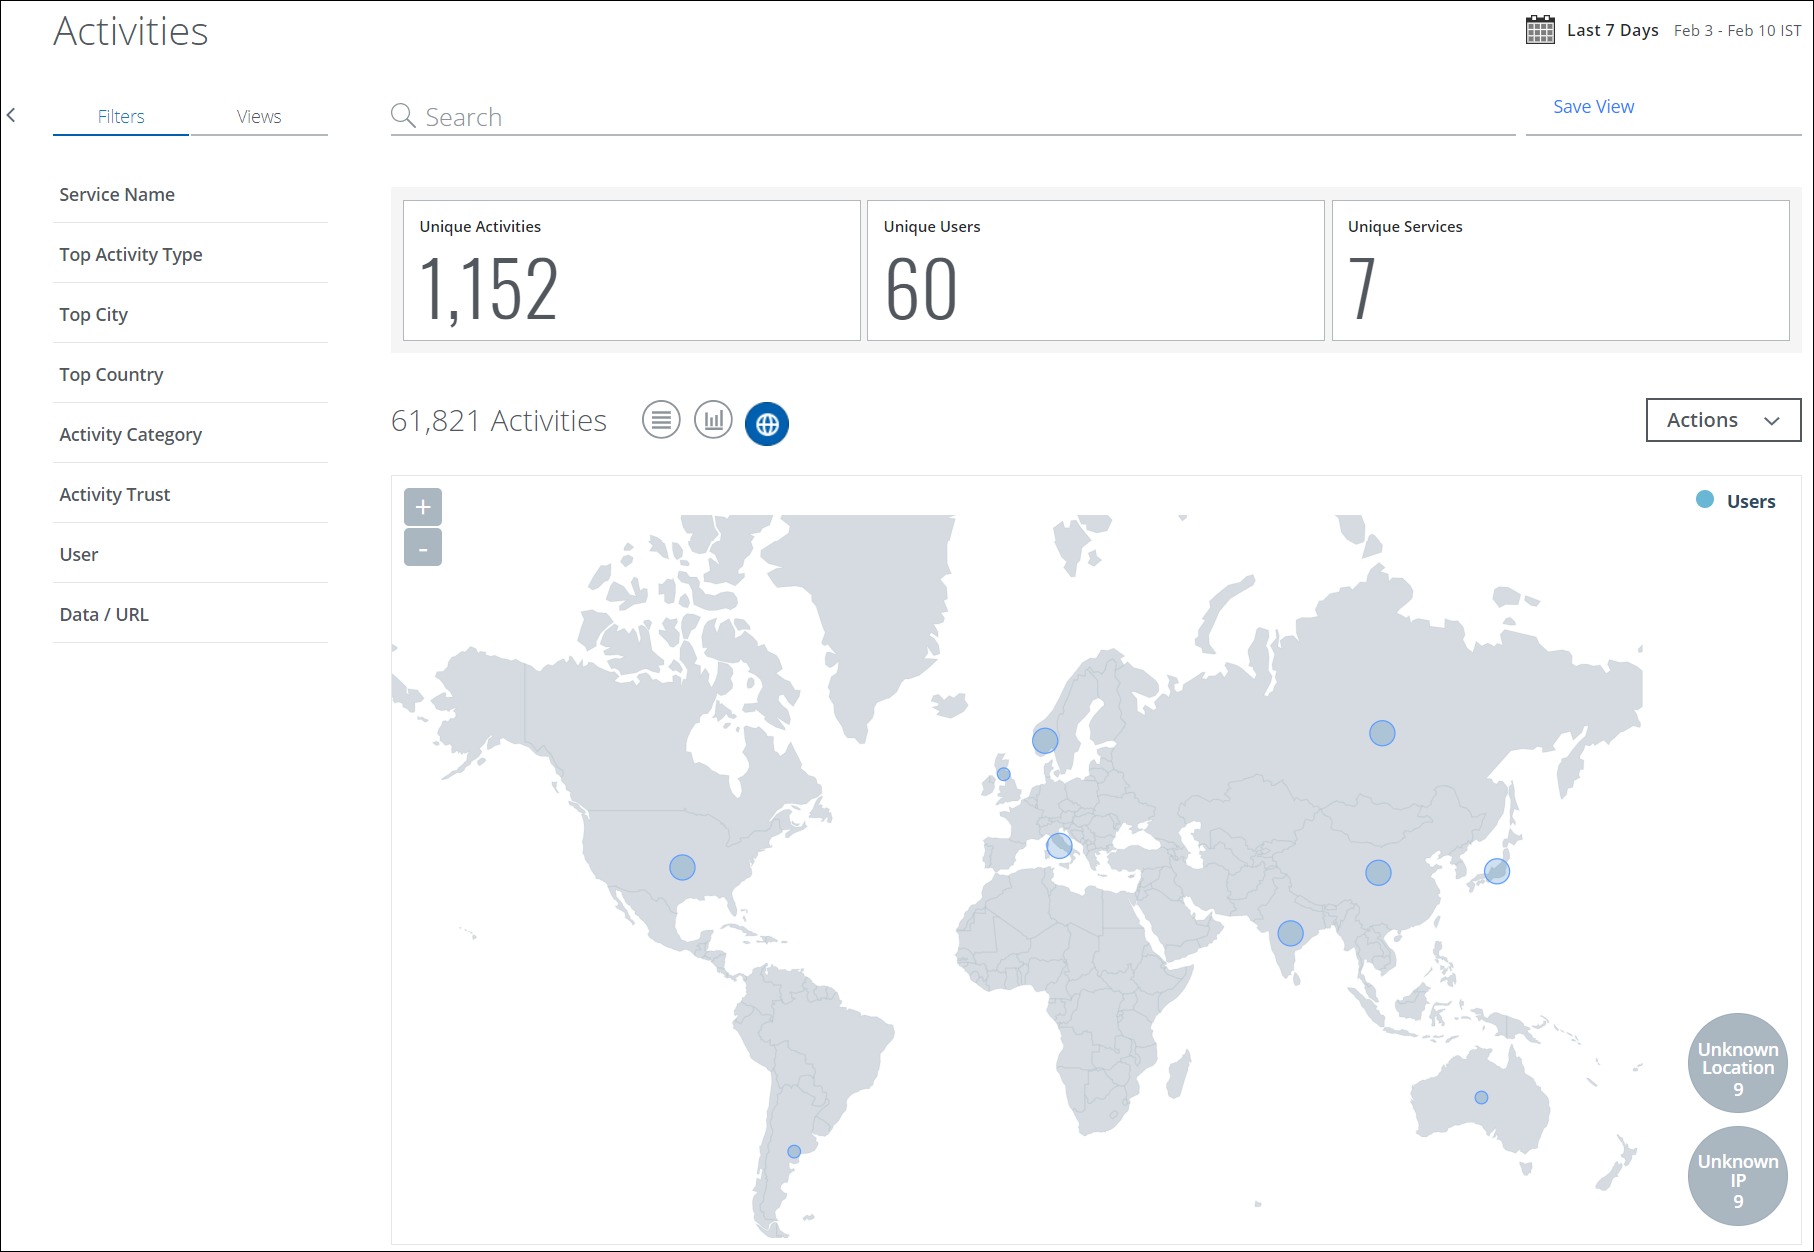
To display your Activities data in a map view, click the Geo Location icon under the Omnibar.
The Activity Geo Location view displays a world map with bubbles based on the number of unique detected users. You can use this view to see how your organization interacts with the cloud on a global level.
You can prioritize your cloud security strategy by the location where specific activities and anomalies occur most often, and find out which locations are most prone to specific threats.

Use the following actions in the Geo Location tab:
- Zoom. Use the + and - buttons to zoom in and out of the map, getting more information on the specific locations of the activity.
- Click. Click a bubble to show the number of unique detected users.
- Unknown Location. A count of all activity that is not attributed to a specific location.
