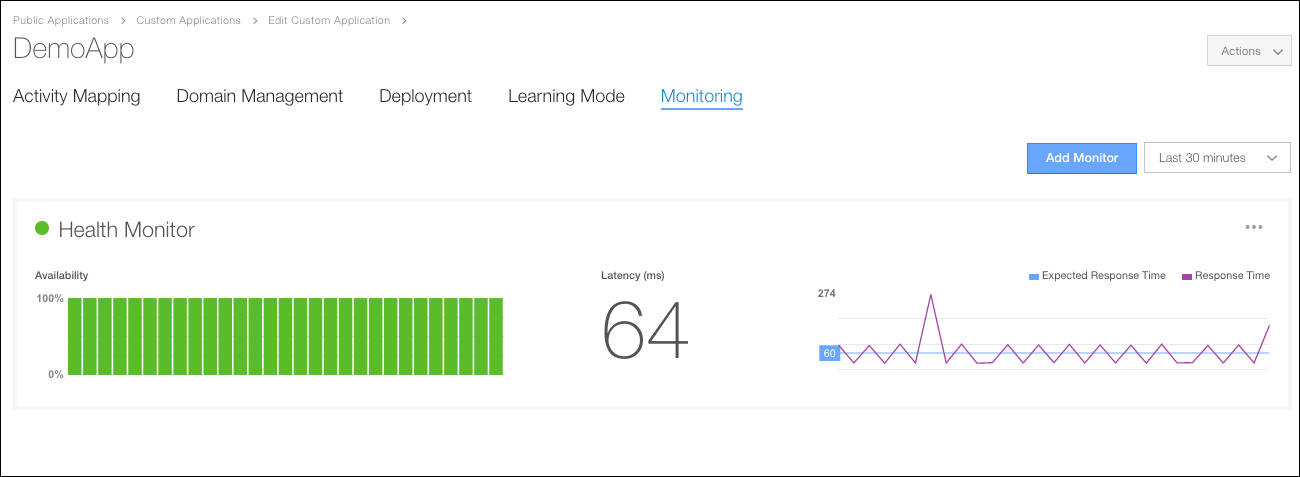
Monitor Custom Apps
The Monitoring page of Custom Apps allows you to keep an eye on the health using availability and latency (in milliseconds) of an app. The metrics are updated every five minutes by default. You can see values for up to one month ago.
Monitors are configured to use HTTP response codes to test Custom Apps. If you're noticing issues with an app, especially third-party apps that are run by cloud service companies, using a 400 error code in a Monitor gives you near real-time insight into that downtime. Multiple Monitors can be created for an app, so you could create both an uptime and downtime Monitor.
Latency is measured against a benchmark value you enter, and is shown in a graph so you can easily see times of higher latency.

To add a Monitor:
- In the app's page, click Monitoring.
- Click Add Monitor.
- Enter the following information:
- Name. Type a name for the Monitor.
- URL. This field auto-populates using the URL configured as the app's endpoint.
- Expected Response Code. Type the three-digit status code you'd like to use to test the app's behavior. For example, a 200 code can be used to test the app's availability; use a 400 error code to watch for downtime problems with this app.
- Expected Response Time. Type the number of milliseconds that you want the app to execute.
- Choose an Interval to set the refresh rate.
- If the app uses PUT or GET, choose that option from Method. This is an optional field.
- Click Add.
