About Users
The Users page generates a report on the users accessing specific cloud services within your organization. Use the filters to select a specific service or use the Omnibar to search for a service to generate a users’ overview.
You can display Users data in a Table view, or create a Chart view. It also provides easy access to Filters, Saved Views, and allows you to display the User Cloud Card with a single click. You can also schedule a report of the view in XLS, CSV, or PDF formats.
Table View
The Users page Table view is the default view.
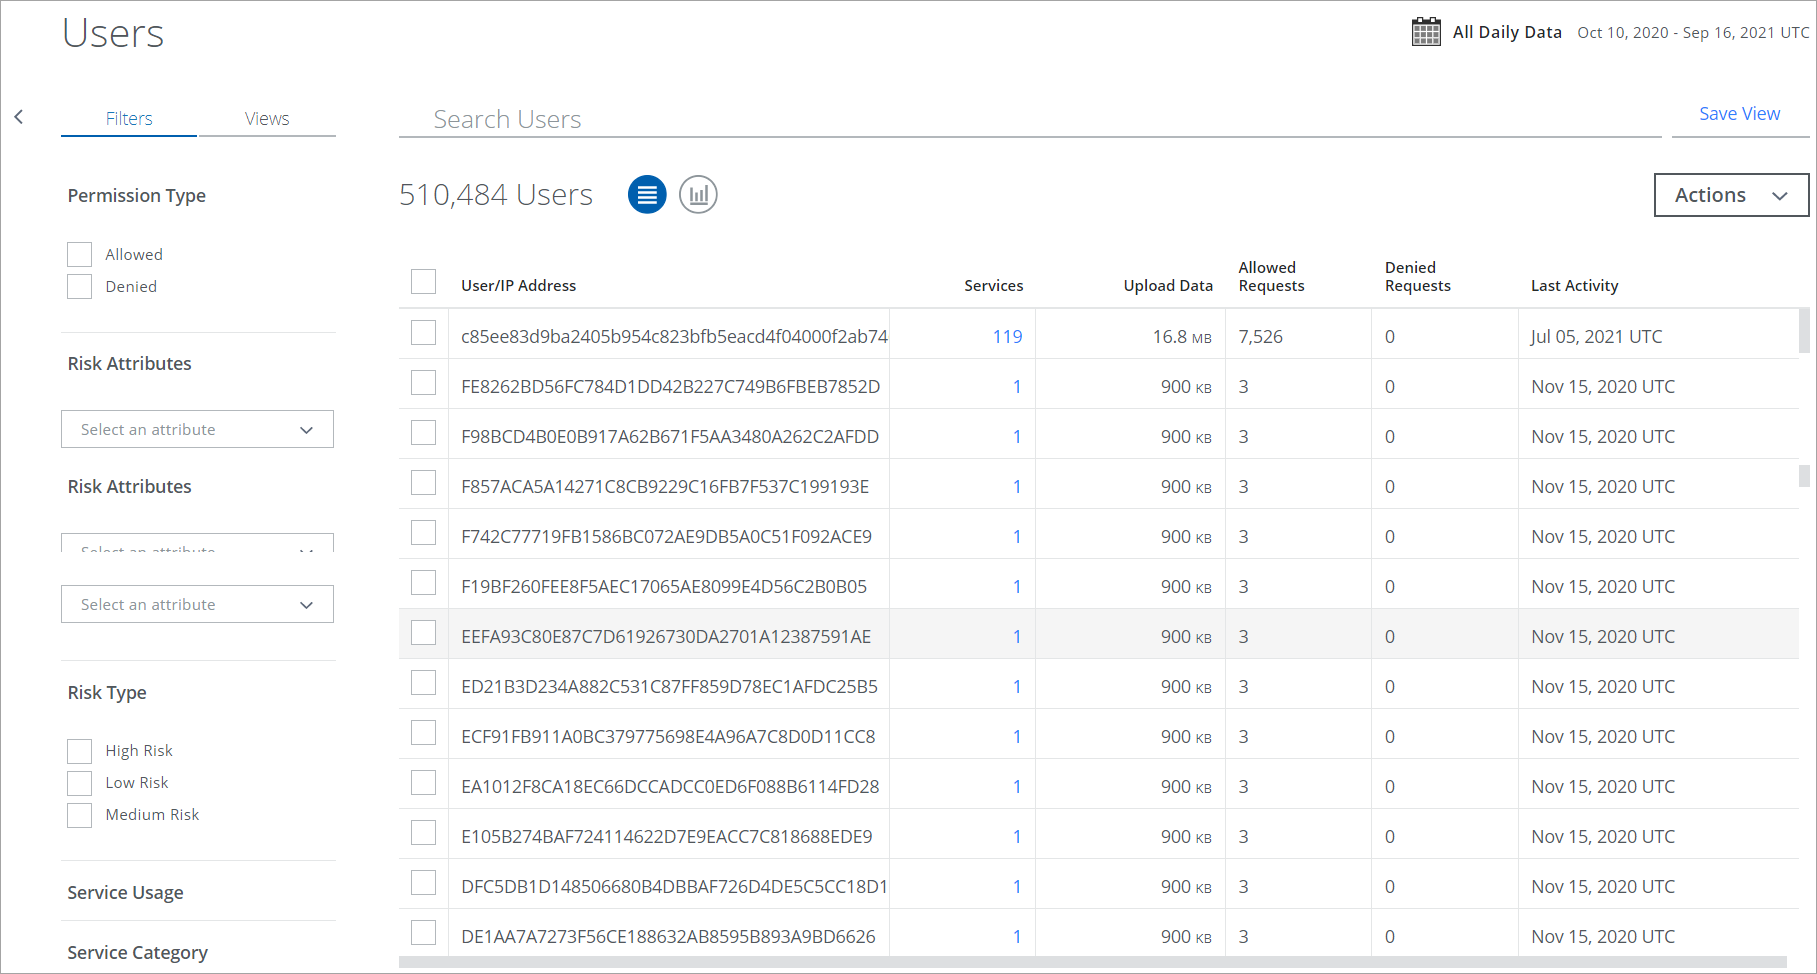
To display User data in the Table view, you can:
- Search. Search via the Omnibar.
- Save View. Click to create a Saved View from your search query.
- Date Picker. Use the Date Picker to select a preset or custom date range to display data from only this date range.
- Filters. Select options on the Filters tab to scope down your search.
- Views. Select Saved Views created by you or shared with you by another user to reuse specified search parameters from a previous search on current data.
- Actions. Click Actions to:
- Watchlists
- Add to Watchlist. Add users to Watchlists, or edit the Watchlists that a user is assigned to.
- Create Report
- Business Report (PDF). Create a PDF report and run it immediately, which then appears in the Report Manager.
- CSV. Create a CSV report and run it immediately, which then appears in the Report Manager.
- XLS. Create an XLS report and run it immediately, which then appears in the Report Manager.
- Schedule. Schedule a report to run later, which then appears in the Report Manager.
- Settings
- Watchlists
- User/IP Address. Click a User in the table to display the User Cloud Card.
- Services. Click the link in the Services column to go directly to the Services page. Sort this column by number in ascending or descending order.
- Upload Data. Amount of data uploaded by the user. Sort this column by number in ascending or descending order.
- Requests. The number of requests associated with the user. Sort this column by number in ascending or descending order.
- Allowed Requests. The number of allowed requests associated with the user. Sort this column by number in ascending or descending order.
- Denied Requests. The number of denied requests associated with the user. Sort this column by number in ascending or descending order.
- Last Activity. The date of the user's last activity. Sort this column by date in ascending or descending order.
- Add to Omnibar Filters. Right-click a cell in the table to Copy the text or Add to Omnibar. Filters are available for the following columns:
- User/IP Address. Adds the User/IP address to the Omnibar.
- Watchlist. Adds the Watchlist name to the Omnibar.
- Custom Attributes. Available only for Custom Attributes displayed in the Filters tab.
User Cloud Card
Click a User in the table to display the Cloud Card. Click the user again to hide the Cloud Card, or click the X on the pane.
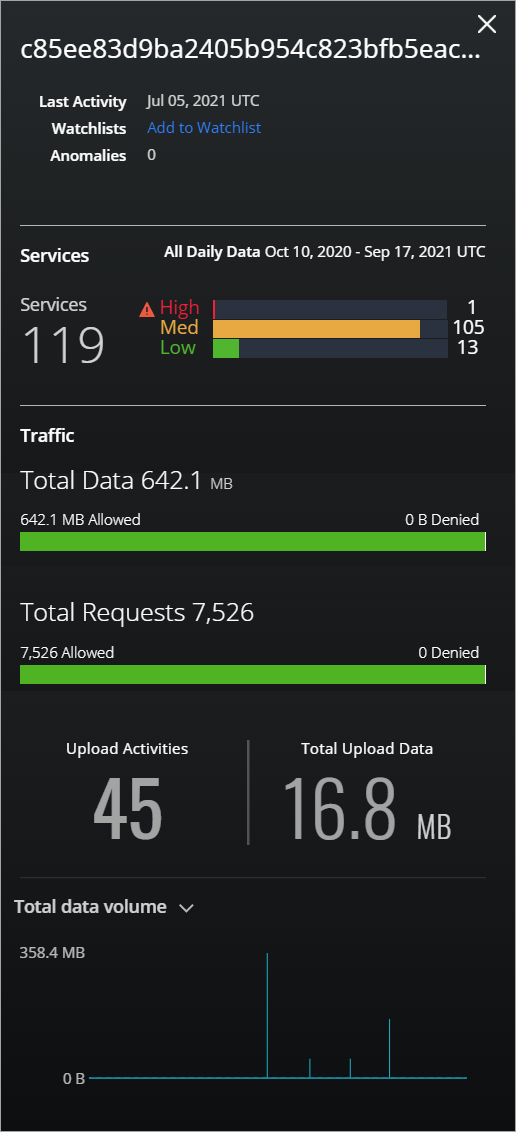
The Cloud Card provides the following information:
- User name. Displays the user name and associated activity and details. Click any activity link to go to the full Users modal for that activity.
- Last Activity. The date of the user's last activity.
- Watchlists. Click the link to add the user to a Watchlist.
- Anomalies. Click to open the Anomalies modal.
- Services. Click the Services number, or High, Medium, and Low to go to the Services page with that search term pre-filled in the Omnibar. You can also click the Services heading to hide that section of the pane.
- Traffic. The Traffic section of the pane displays the User's metrics for Total Data, Total Requests, Upload Activities, and Total Upload Data. You can also click the Traffic heading to hide that section of the pane.
- Upload Activities. Click to open the Upload Activities modal. Sort this column by number in ascending or descending order.
NOTE: Skyhigh no longer supports the Upload Activities modal and the hyperlink for Shadow IT users, retrieving third-party proxy logs. However, the Total Upload Data of the user continues to display. You can view the SWG Cloud granular activities data on the Activity Monitoring page.
- Total Upload Data. The total data uploaded for the user.
- Chart. Select a value from the list to display a chart of the user's activity.
Chart View
To display your Services data in a chart, click the Chart icon under the Omnibar.
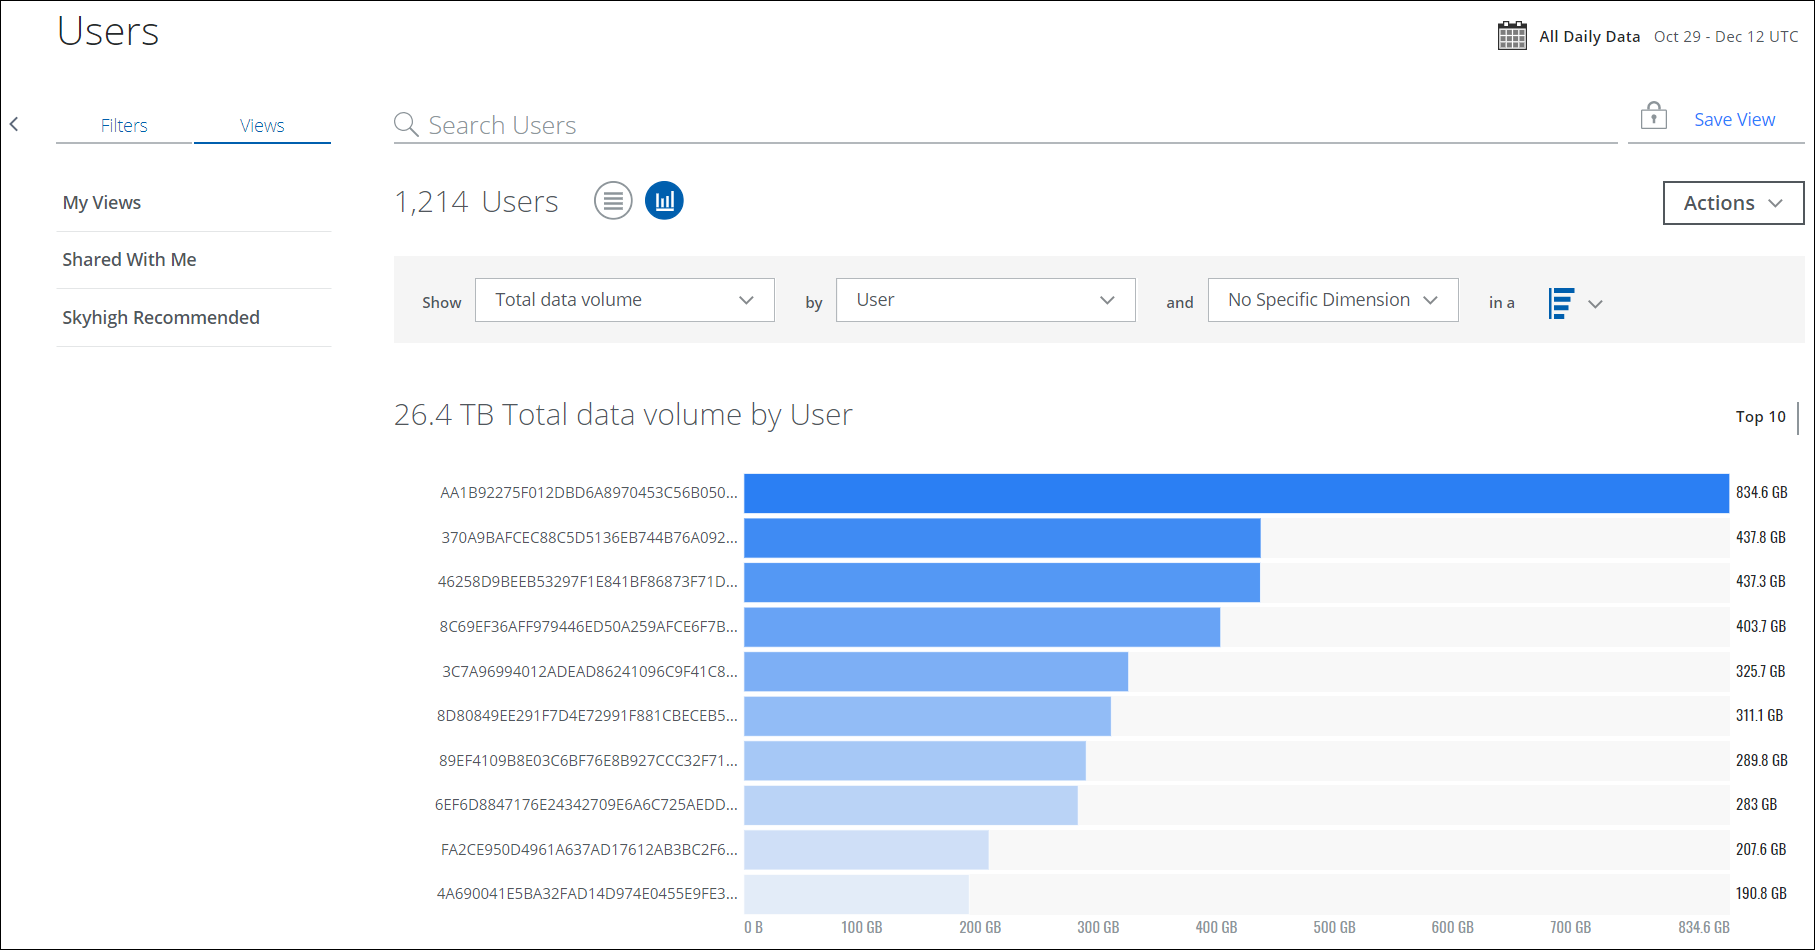
To display User data in a chart:
- Show. Select an item from the Show list to determine the X axis of your chart.
- By. Select an item from the By list to determine the Y axis of your chart.
- And. In the and dialog, select the third parameter, if available.
- In a. From the In a list, select your chart type:
- Trend. Line or vertical bar chart.
- Breakdown. Donut or horizontal bar chart.
Your data is displayed in the chart.
Upload Activities Modal
The count shows the number of upload activities associated with the user. This list has been filtered to expose relevant upload activities.
The following filters are used to display Upload Activities:
- The Upload Activities modal only shows activities that use the Put, Post, and Connect methods. Other methods are not included.
- If the uploaded bytes, also called CSBytes, are less than 8 Kb, it is not considered Upload Activity.
- In the upload event, upload bytes are bigger than download bytes. Otherwise, it is not considered Upload Activity.
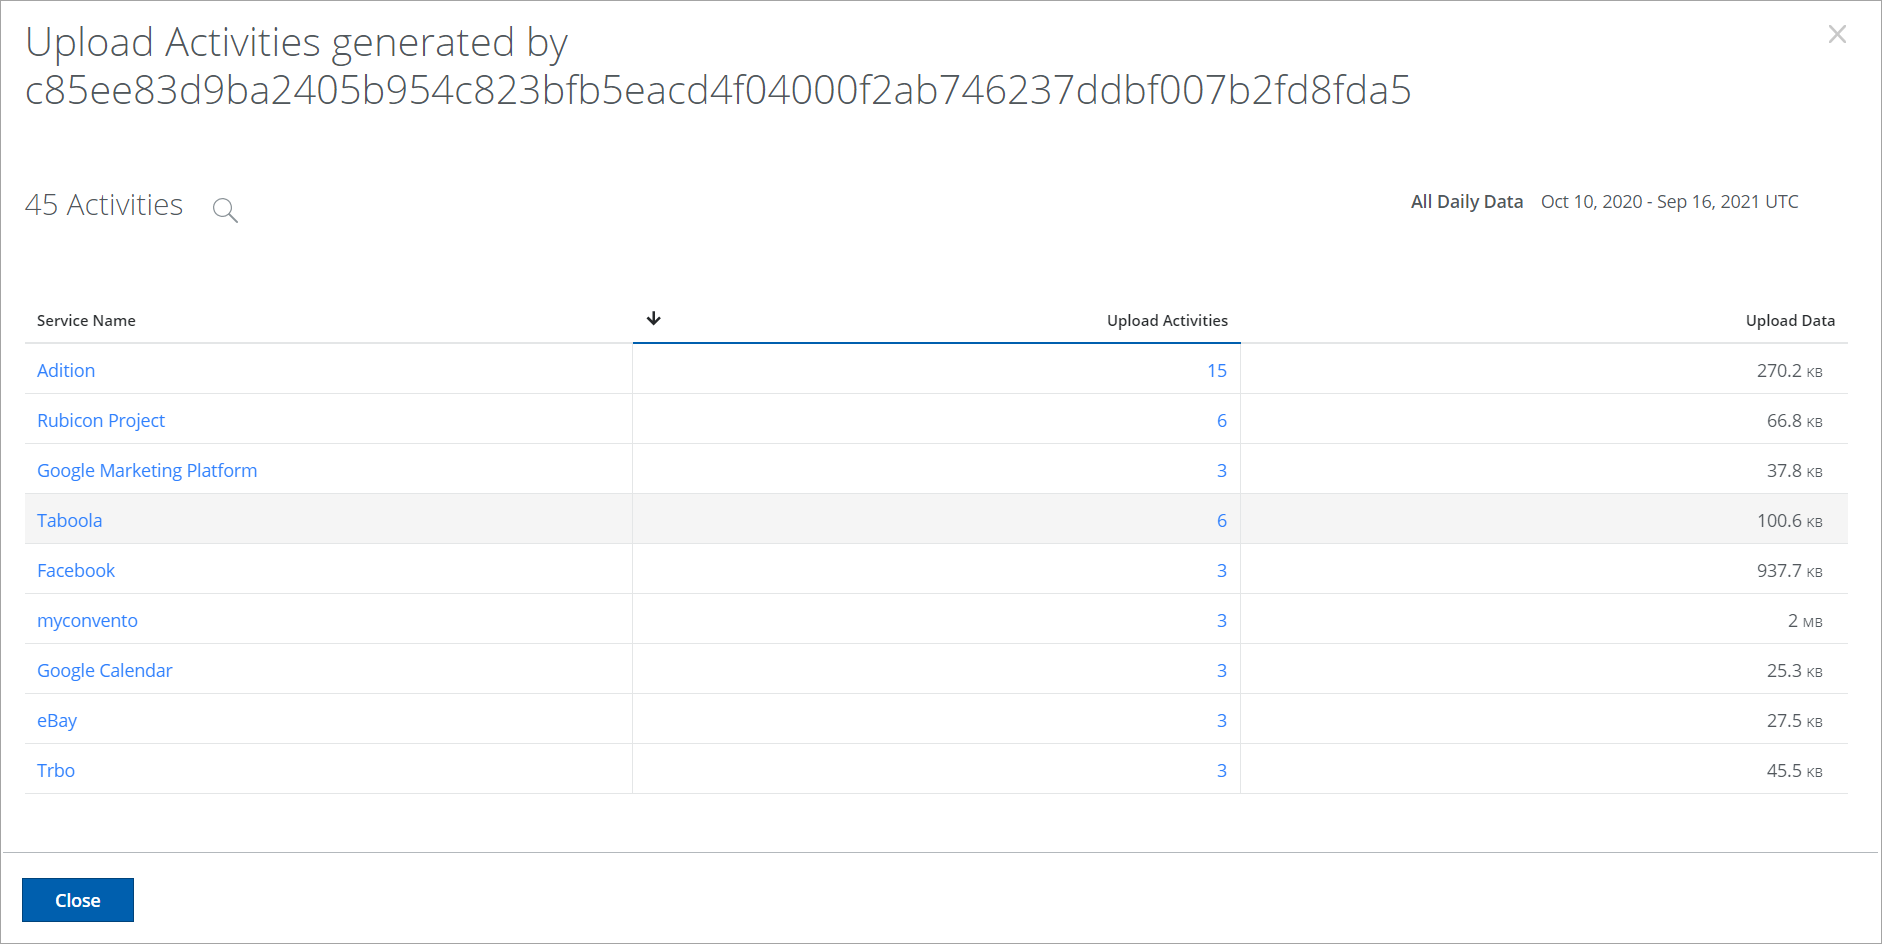
The Upload Activities modal displays a list of activities from most activities to least.
The Upload Activities modal provides the following details:
- Service Name. Click to go to the Service Details page.
- Upload Activities. Click to see the activities page of the selected service.
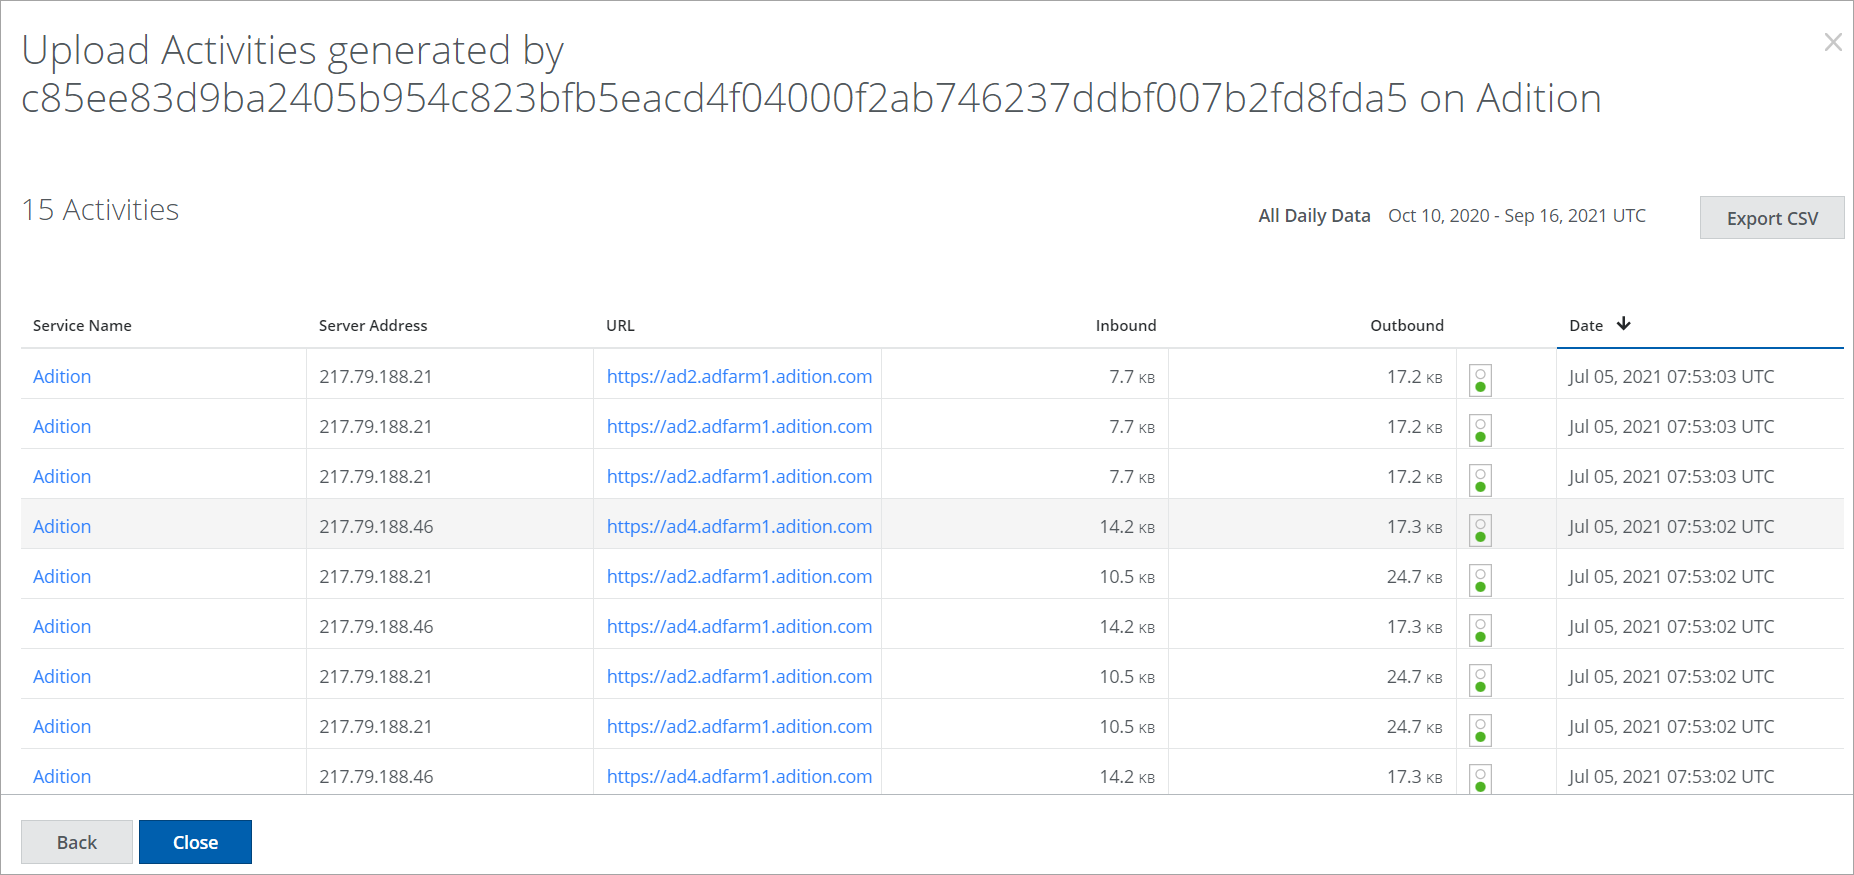
- Export CSV. Click to export the information in this table to an XLSX file in CSV format.
- Server Address. IP address.
- URL. The URL of the Cloud Service Provider.
- Inbound. Inbound data amount.
- Outbound. Outbound data amount.
- Traffic. Allowed shows a green icon. Denied shows a red icon.
- Date. Date and time that the activity was performed.
- Back. Click to return to the main Upload Activities modal.
- Close. Click to close the modal.
- Upload Data. The amount of data uploaded by this user for this service.
- Close. Click to close the modal.
Anomalies Modal
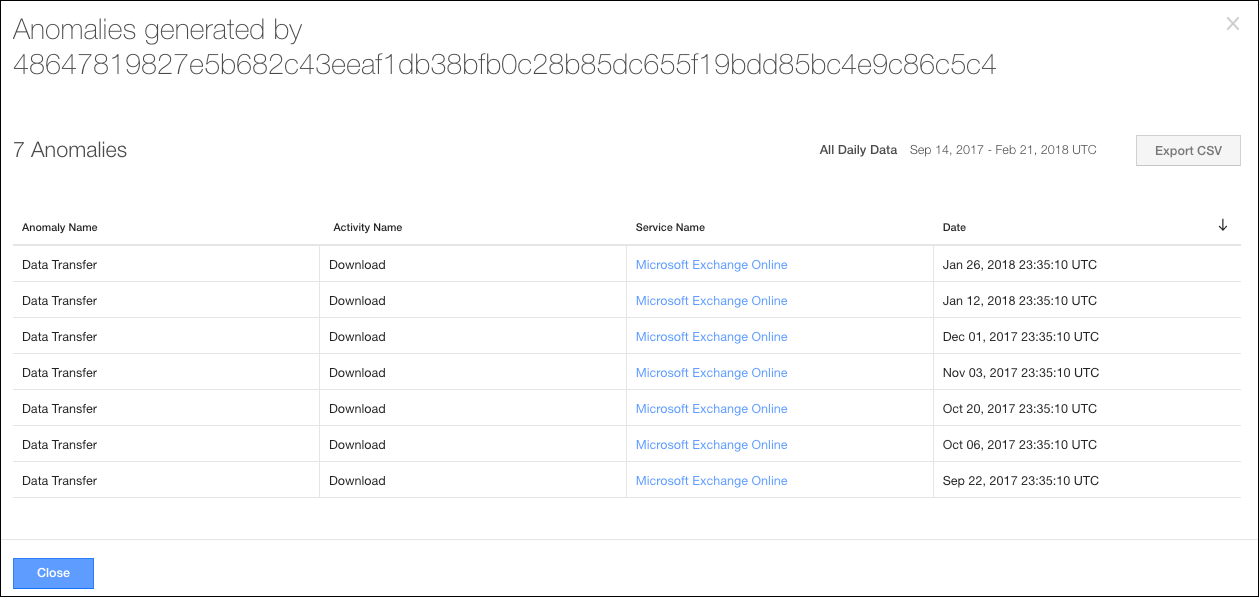
The Anomalies modal provides the following details:
- Anomaly Name. The name of the anomaly that occurred.
- Activity Name. The type of activity that occurred.
- Service Name. Click to go to the Service Details page.
- Date. The date and time that the anomaly occurred.
- Export CSV. Click to export the information in this table to an XLSX file in CSV format.
