Cloud Security Advisor Score Chart
The Score Chart is the heart of the Cloud Security Advisor, where you can see how the checklist items you have applied have changed your score and improved your organization's security posture.
Use the filters to drill down and see specific details and make more granular improvements for All Product Groups, All Products, and All Instances.
IMPORTANT: The new Instance filter view causes Visibility and Control scores to be calculated differently. You can expect to see a minor reduction of scores as Skyhigh CASB now considers instance-level granularity.
All Product Groups
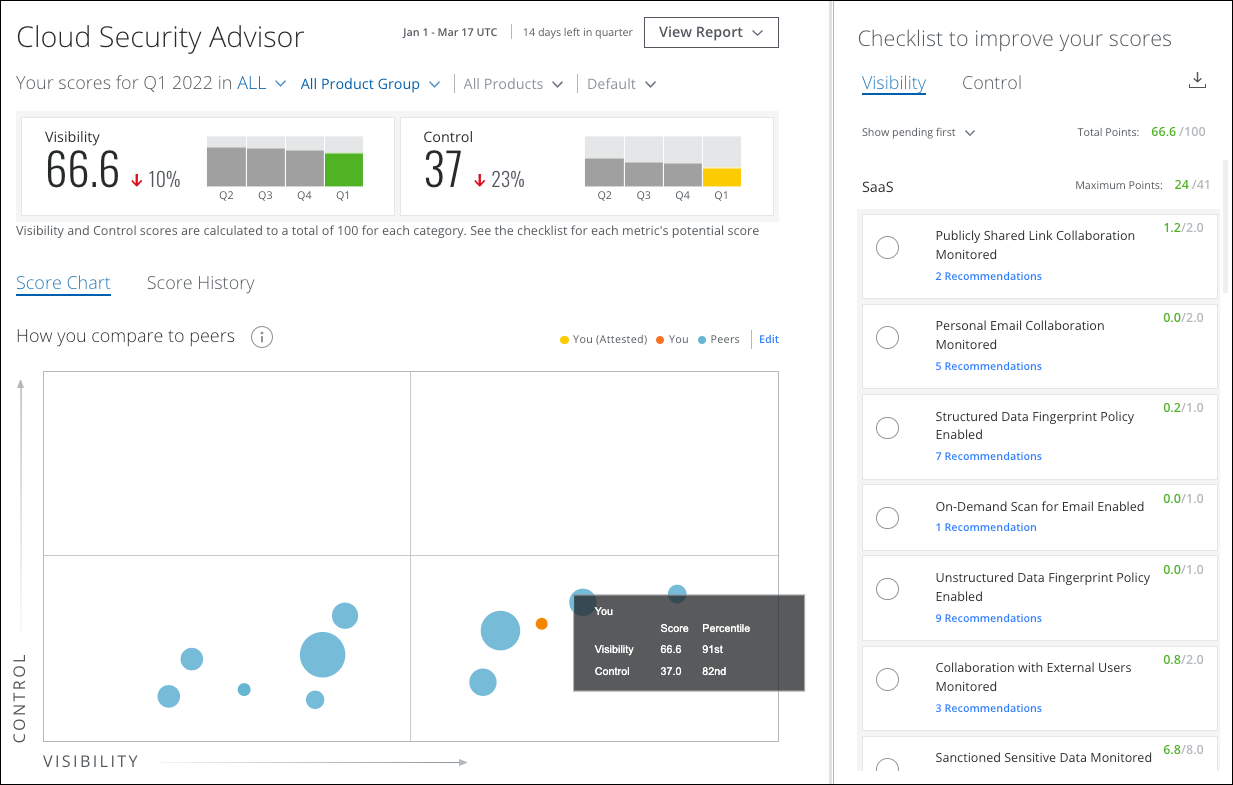
The All Product Groups filter displays all of your organization's product groups in the Score Chart to compare your Visibility and Control scores to your selected peers.
The Score Chart displays your score as a dot on a four-quarter graph. Hover over the dot to display your specific Visiblity and Control scores.
- You (Attested). The yellow dot represents your score including the recommendations you have acted on and any waivers or credits you have implemented.
- You. The orange dot represents your score and only the recommendations you have acted on.
- Peers. The blue dots represent the score of the peers you have selected to be compared to.
- Edit. An admin can click Edit and select up to 10 vertical markets to compare.
The Visibility and Control Checklist filters to display items relevant only to this selection.
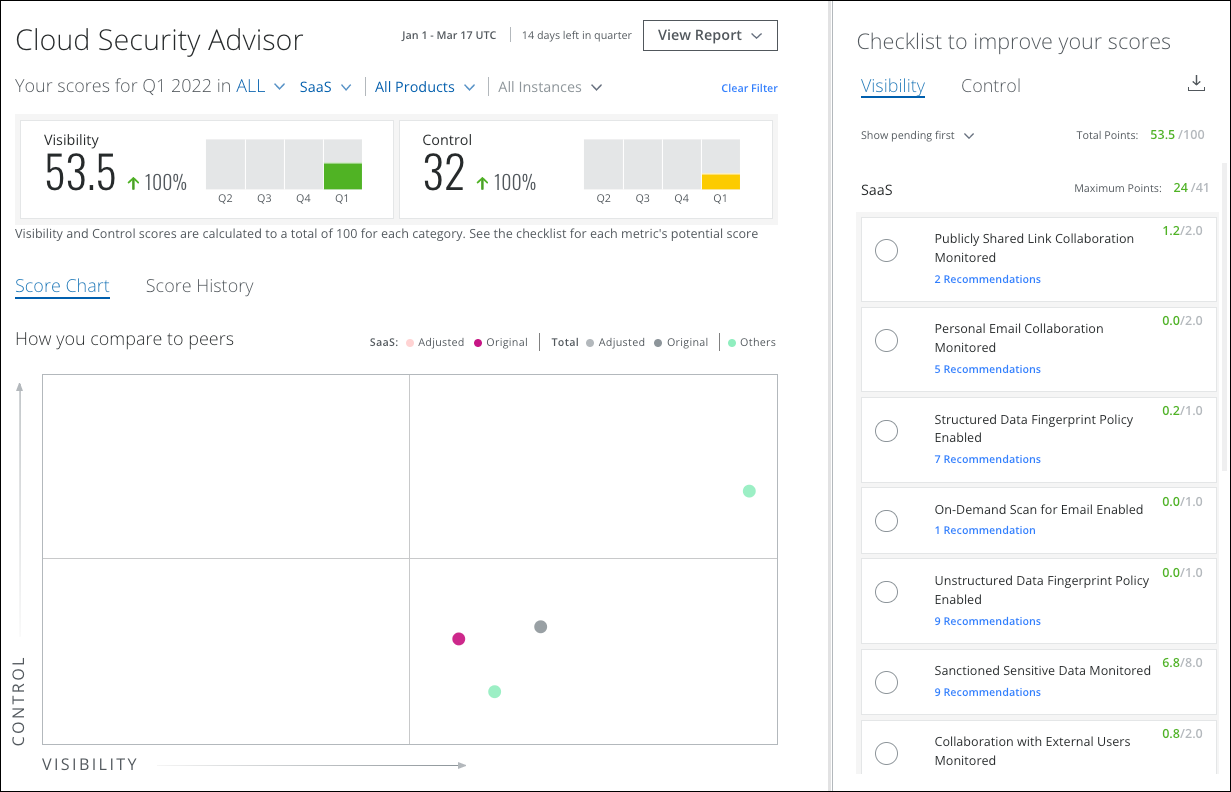
When you select a Product Group from the list, such as SaaS, the Score Chart changes to display your SaaS product group Visibility and Control scores compared to your Shadow IT and IaaS scores.
The Visibility and Control Checklist filters to display items relevant only to the SaaS product group.
All Products
When you select a Product Group, the All Products filter becomes available.
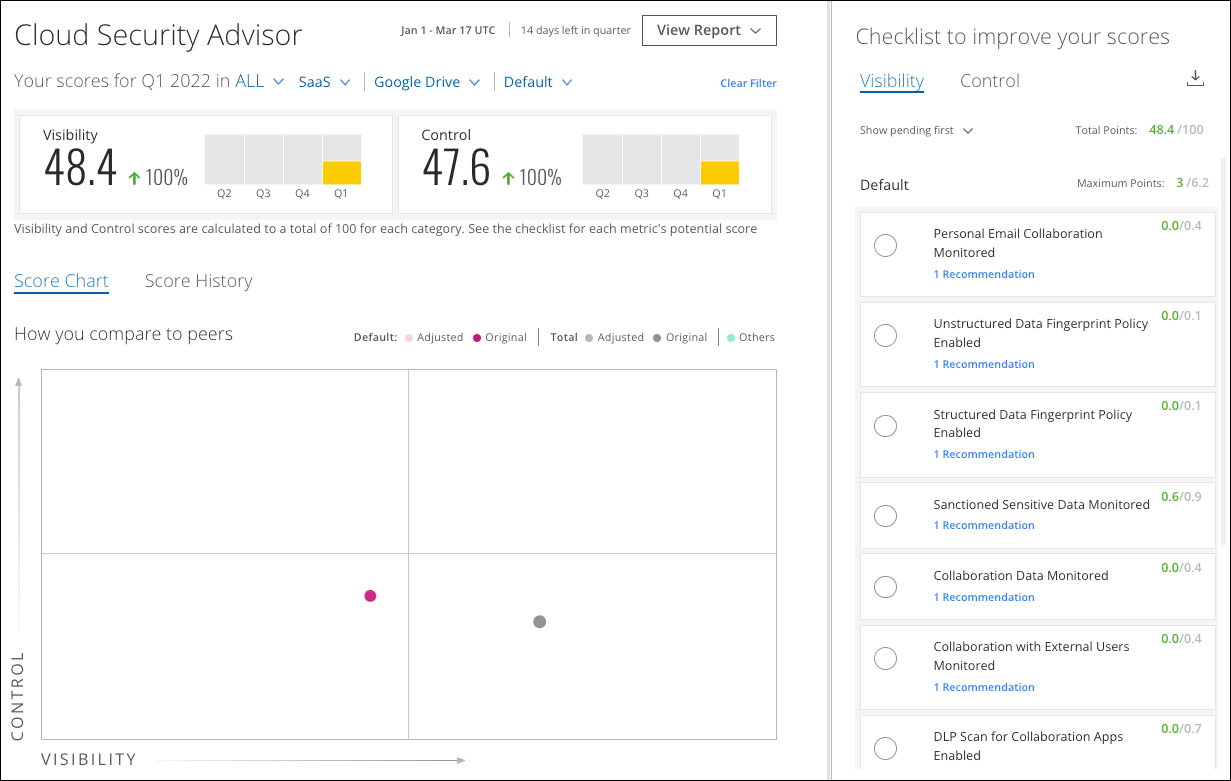
Select a specific SaaS product, such as Google Drive, to display your Google Drive Visibility and Control scores compared to your other SaaS product scores. For example, your Control score for Google Drive is much higher than your Control score for Gmail.
The Visibility and Control Checklist filters to display items relevant only to Google Drive.
All Instances
When you select a Product, the All Instances filter becomes available.
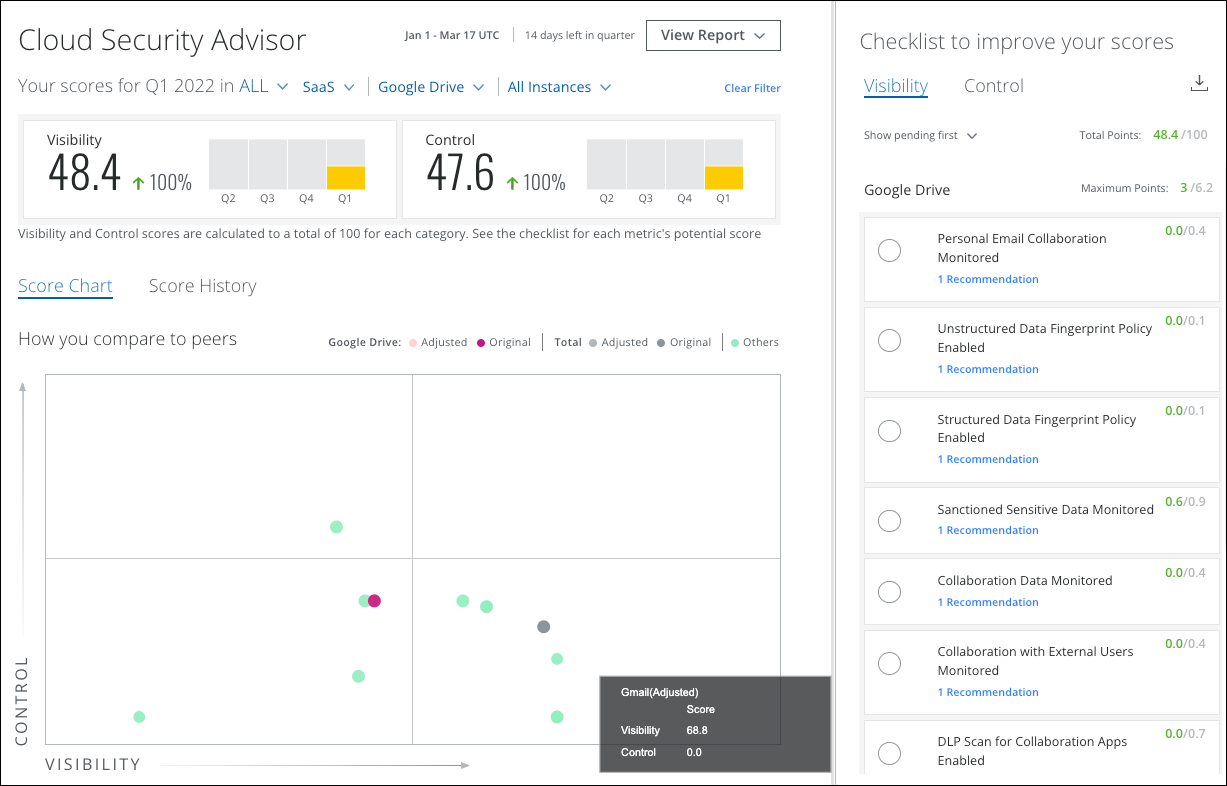
Select a specific tenant instance to compare your instance's Visibility and Control scores to your other instances, if available.
The Visibility and Control Checklist filters to display items relevant only to that instance.