Work with Rule Traces
In SSE, rule tracing facilitates the tracking of the path taken when evaluating a policy for a user, as well as the rule or ruleset that was assessed to determine whether to allow or block a request. You can obtain the logs through rule tracing and view the path that the traffic traversed in the web policy tree. You can then use the rule tracing logs for troubleshooting.
The SSE admin can generate a rule tracing activation URL. The URL is passed to the end user to use just before them starting rule tracing. The tracing logs are available to the SSE admin once rule tracing is completed.
Rule Tracing Process
Follow the steps given here to trace the processing of the rules.
| # | Step | Initiated By |
|---|---|---|
| 1 | Generate the URL | Admin |
| 2 | Initiate a rule tracing session by starting the trace, reproduce the issue and then stop the trace session | End User |
| 3 | Analyze the rule traces | Admin |
Generate the URL
On the user interface for Secure Web Gateway, you generate a rule tracing activation URL. This URL is required to enable tracing of the client traffic. On the user interface for Secure Web Gateway, place your mouse pointer over the settings icon in the top right corner, then select Infrastructure > Web Gateway Setup from the drop-down menus.
- On the Secure Web Gateway Setup page, scroll down to Rule Tracing.

- Click on Rule Tracing.
- On the Rule Tracing page, under Getting Started with Rule Tracing, generate a URL for rule engine tracing.
- Click Generate URL.

- On the Generate URL for Rule Tracing right pane, enter an authenticated user name in the User Name field.
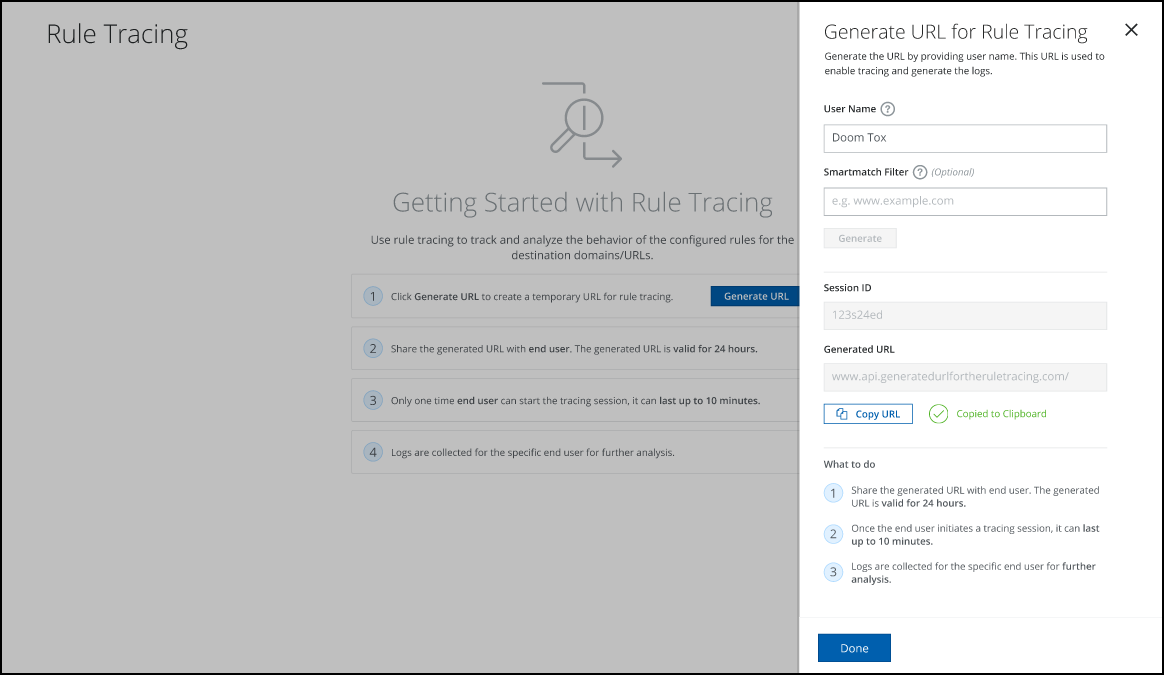
- Enter the username of the tracing user from the "whoami" command on Windows or Mac.
- Optionally, enter a SmartMatch filter term in the SmartMatch Filter field. SmartMatch Filter is the filter field where the user can filter the trace to a particular host or website (e.g., facebook.com, gmail.com, etc.).
- Click Generate.
A session ID is generated and displayed under Session ID. The SSE Admin should note the Session ID for use when the trace needs to be viewed.
A URL is generated and displayed under Generated URL. The token ID is embedded in the URL. Admin should share this URL with the end user to enable tracing in the client.
7. Click Done to return to the setup page.
NOTE: The generated URL is valid for 24 hours and can only be used once. Once tracing is started with this URL, it cannot be used again. The end user will have 10 minutes to reproduce the issue once the trace is started. The generated trace logs will be available for 31 days, and there is no limit on the number of files stored.
Initiate a Policy Rule Tracing Session
The admin generates a URL and shares it with the end user to trace the policy. The end user will use this URL and will start the trace.
Follow the below steps to trace the policy:
- To trace the policy, paste the URL in the address bar.
- In the Action, select Start tracing.
- Click on Execute to start tracing. You can continue reproducing the issue in the same browser.
- In the Action, select Stop tracing.
- Policy Rule tracing logs are generated, which record the rule engine's individual steps.
The log trace will be stored and made available to the SSE Admin.
NOTE: After ten minutes, the tracing stops automatically. Alternatively, you can manually Stop tracing as soon as the issue is reproduced, rather than waiting for the expiration time. This helps minimize unnecessary trace data for troubleshooting purposes.

View the Generated Trace Logs
On the Rule Tracing page, admins can choose to view the existing trace logs or initiate the creation of a new URL for a new rule trace.
Complete the following steps to view the generated trace logs:
- Under Session ID, go to the required Session ID and click on Start Analyzing to start the analysis.
.png?revision=1)
-
Click on Generate URL if you need to generate a URL again for a new token, and start tracing again.
Analyze the Rule Tracing
Analyze the rule tracing logs:
- Under Region, select the required region.
- Select the required session ID under Available Session ID.
- Select the required individual transaction log in the left pane.
- The policy tree view is available in the right pane for the selected trace log.
- You can view the top properties, policy codes, and evaluation details
-
Properties - provides detailed information about the client and request.
-
Policy Code - shows the corresponding policy code for the selected rule set.
- Evaluation Details - gives a detailed view of what function or criteria was evaluated and the corresponding result.
-
