Web Malware Page
The Web Malware page provides a look at traffic data for your organization that can be sorted or filtered to suit your investigation or reporting.
You can view the aggregated traffic data by number of visits, website name, application name, number of requests (hits), allowed or denied requests, and number of bytes downloaded and uploaded. You can also view the traffic reputation (security risks) of web malware.
By default, it displays data for the last seven days. You can use the Date Picker to change the date range. You can also select between UTC and your local time zone from a dropdown menu within the date picker. Viewing data in your local time zone can enhance usability.

Detailed Insights via Expandable Side Panel
- To view the details of a specific site, click on the row, and a side panel will open, displaying information for all available fields.
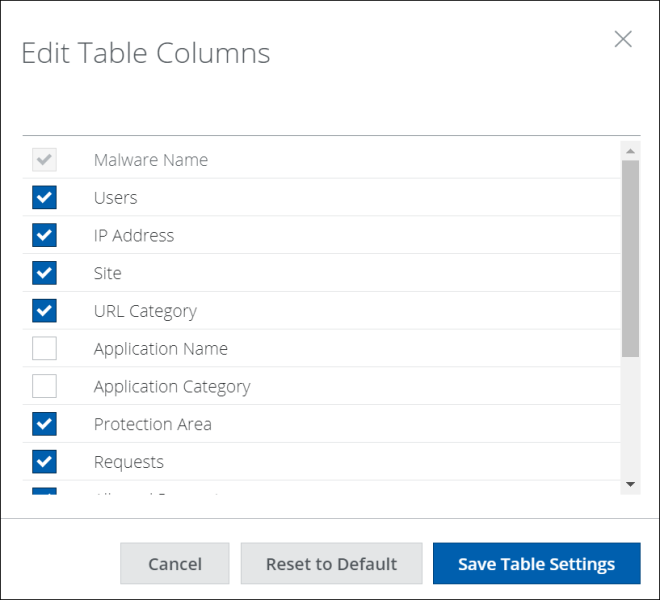
- Navigate to Actions > Edit Table Columns to select the required fields. You will then have options to cancel, set to default, or save the table settings.

- It can be time-consuming if there are many fields in a row and you want to navigate to a field at the end. To address this, clicking on any row will display all the details in that row, making the interface more user-friendly.
- The side panel will display details of events, traffic, and usage trends. By default, these sections are expandable and can be collapsed.

- In the event section, you will find details such as type, reputation, URL category, and username. Click the funnel icon next to the desired event to apply a filter.
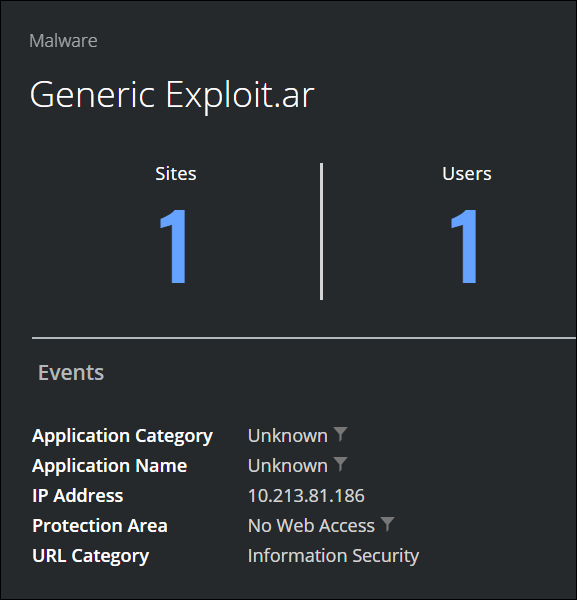
- Reputation risk values are color-coded: green indicates minimal risk, grey indicates unverified, yellow indicates medium, and red indicates high risk.
- In the traffic section, you will see details about requests and total data.
- The user trend section in the side panel displays a graph of the site’s activity for the selected time. The chart includes options to view customized data on site usage.
