Skip to main content
Detailed Insights via Expandable Side Panel
- To view the details of a specific site, click on the row, and a side panel will open, displaying information for all available fields.
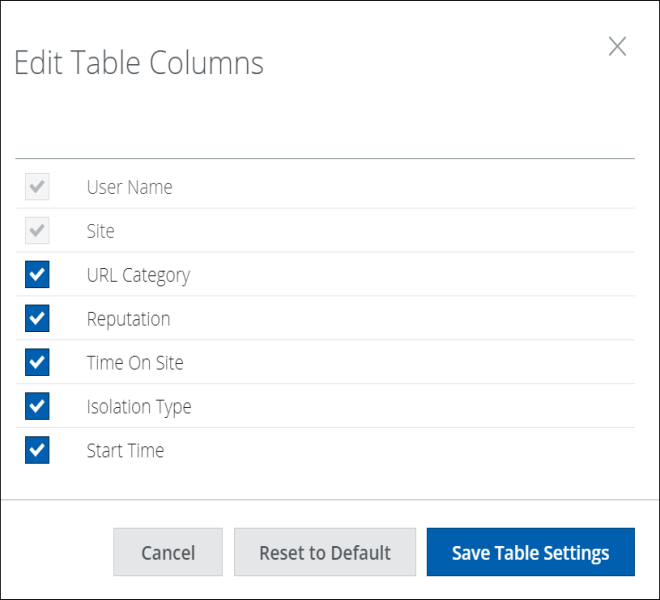
- Navigate to Actions > Edit Table Columns to select the required fields. You will then have options to cancel, set to default, or save the table settings.
- It can be time-consuming if there are many fields in a row and you want to navigate to a field at the end. To address this, clicking on any row will display all the details in that row, making the interface more user-friendly.
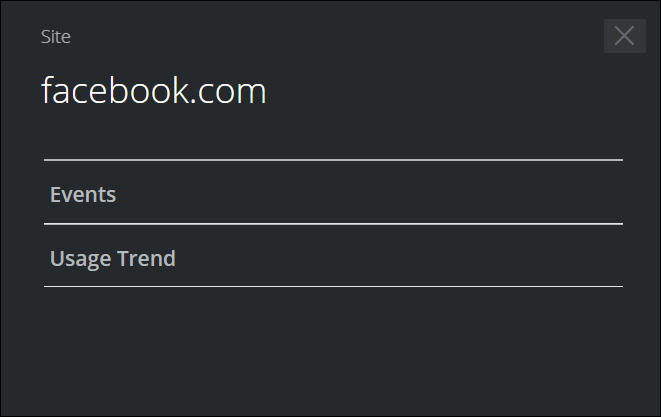
- The side panel will display details of events and usage trends. By default, these sections are expandable and can be collapsed.
- In the event section, you will find details such as type, reputation, URL category, and username. Click the funnel icon next to the desired event to apply a filter.

- Reputation risk values are color-coded: green indicates minimal risk, grey indicates unverified, yellow indicates medium, and red indicates high risk.
- The user trend section in the side panel displays a graph of the site’s activity for the selected time. The chart includes options to view customized data on site usage.
