Overview of Data Explorer User Interface
The Data Explorer page consolidates data discovered during scans across various environments, including SaaS, IaaS, email, web, and private apps. It enables the visualization, discovery, and analysis of sensitive data (in motion, at rest, or in use), as well as its associated risks. The discovered data is crucial for understanding data locations, usage, access controls, vulnerabilities, and compliance. This page provides easy access to various filters to narrow your desired results in seconds.
To access the Data Explorer page, go to the Analytics > DSPM Data Explorer.
NOTE: To access DSPM Data Explorer, you must have a license and the DSPM Management role enabled. For assistance, contact Skyhigh Support.
Data Explorer provides two primary display modes for visual data presentation: Table View and Chart View. It is specifically designed to provide a consolidated, high-level overview of information concerning top-level objects. This design principle dictates that data aggregation and presentation should focus on the parent object or original item, not its granular, extracted components.
For instance, consider a scenario with a compressed file, such as a zip archive, that initially measures 100 KB. Upon decompression, the file's contents are revealed, which may collectively expand to a total size of 500 KB and may contain items that trigger various data classifications such as PCI, PII, HIPAA, and more. In this specific instance, the Data Explorer presents the information to the top-level object that is the original zip file itself, and not the extracted, internal contents. Consequently:
- Size Metric. The metric reported for Total Data will be based on the original size of the object submitted for processing, which is the initial 100 KB zip file. The expanded size (500 KB) is used for analysis but is not the primary metric displayed in the top-level view.
- Classification Aggregation. Critically, all classifications and risk attributes detected within any of the expanded internal items are aggregated and attributed directly to the parent zip file. The Data Explorer lists these cumulative classifications against the single top-level object entry.
Comprehensive Object Metadata Presentation
The Data Explorer functions as a central repository for all metadata surrounding these detected objects. This includes comprehensive information on:
- All Classifications Detected. A list of all classification that is part of the object triggered.
- Services Involved. The specific services that interacted with the object.
- User Information. Data identifying the user responsible for or associated with the object’s transaction.
Object Classification Behavior
The presentation logic ensures that once an object is flagged, all relevant associated information remains tied to it, even when using filtering mechanisms. This maintains the integrity of the object's profile:
For example, consider a scenario where a single document or file contains both Personally Identifiable Information (PII) and Payment Card Industry (PCI) data. An administrator applies a filter in the user interface specifically to display only objects flagged for PII violations. The following behavior will occur:
- The Data Explorer identifies the object because it matches the requested PII classification.
- It displays all associated classifications once the object is selected.
- It lists PCI classifications alongside PII, even when the filter is set only for PII.
Table View
The Data Explorer Table View is a default view and provides a concise, high-level overview of critical system data, emphasizing areas of significant concern for proactive risk management and data security. Key components of this view include:
- Filters. Allows for the selection of a primary filter category first, followed by the choice of specific options within that category. This organized structure provides enhanced visibility and facilitates quick data discovery to pinpoint the exact data you need in seconds. For example, you can use the Filters to drill down into a specific Service Category, such high-risk AI service category. The SOC can then prioritize incident response and conduct forensic analysis, focusing on the specific object type involved within the relevant AI service category.
- Tabs. This component focuses on four key data vectors that are essential for:
- Identifying the riskiest objects
- Understanding how classifications categorize sensitive data with the risk level
- Pinpointing the services where user data resides
- Identifying the riskiest users
By consolidating these critical data points, the Table View empowers administrators to quickly identify and address security vulnerabilities, ensuring a strong security posture.
The Table View provides the following information:
- Filters. Select options on the Filters tab to narrow your search based on the available parameters, such as Classification, Users, Services, Risks, Object Name, and Digest/Hash. You can switch between Table View and Chart View. Note that the filters remain effective regardless of the view you choose.
- More menu (
 ). Click to narrow your search with more filters, such as Service Category, Object Type, and Classification Category.
- More menu (
- The Table View provides the following tabs:
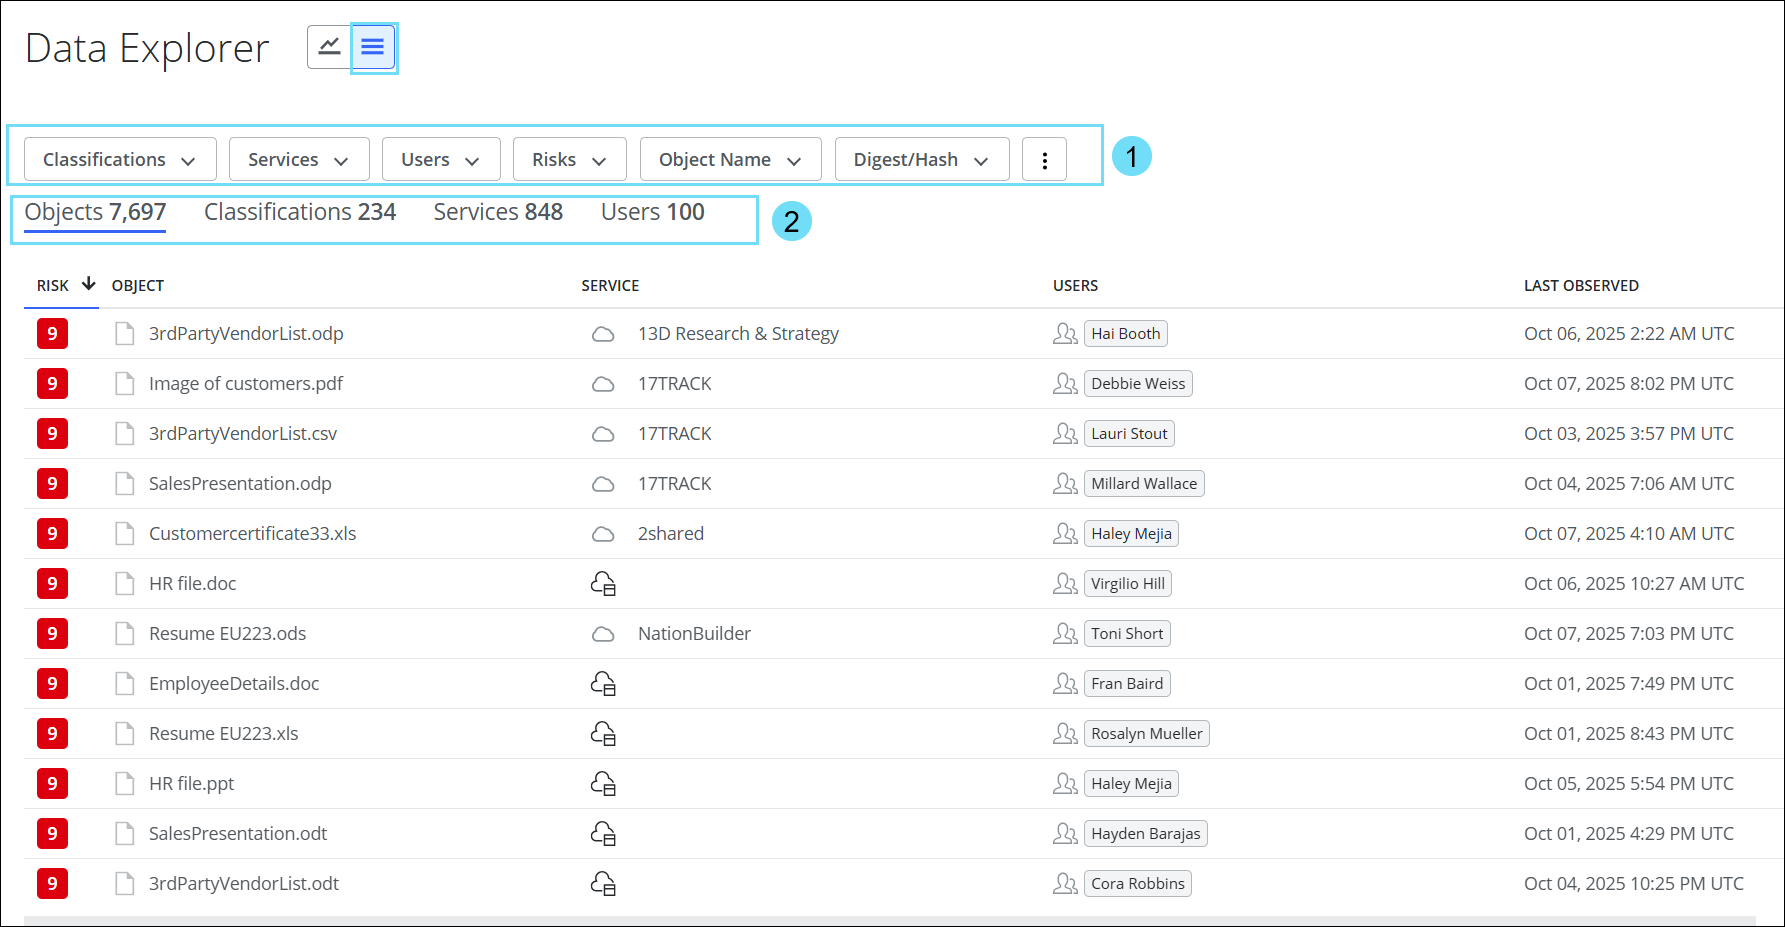
Objects Tab
The Object table provides the following information:
- Objects Count. The total number of objects identified in the organization. The object count will vary based on the selected filter.
- Risk. The risk score of the object. For more details on Object Risk, see Understand the Data Risk Calculations.
- Object. The name of the object.
- Service. The name of the service where the object was discovered.
- Users. The name of the user who interacted with the object.
- Last Observed. The date and time when the object was last identified.
Click any object to view the detailed information of the selected object. For details, see Objects Detail Card.

Classifications Tab
The Classifications table provides the following information:
- Classifications Count. The total number of classifications identified in the organization. The classifications count will vary based on the selected filter.
- Classification. The name of the classification.
- Object Risk. Color codes represent the object risk distribution in classification: Green indicates low risk, Yellow indicates medium risk, and Red indicates high risk. For more details on Object Risk, see Understand the Data Risk Calculations.
- Services. The name of the service where the classification was identified.
- Total Objects. The total number of objects identified in the classification. The data count will vary based on the selected filter.
- Total Data. The total volume of the data discovered in the classification. The data count will vary based on the selected filter.
- Object Distribution. The number of objects distributed between CASB and Web applications.
- Last Observed. The date and time when the classification was last identified.
Click any classification to view the detailed information of the selected classification. For details, see Classifications Detail Card.

Services Tab
The Services table provides the following information:
- Services Count. The total number of services identified in the organization. The services count will vary based on the selected filter.
- Service. The name of the service.
- Object Risk. Color codes represent the object risk distribution in services: Green indicates low risk, Yellow indicates medium risk, and Red indicates high risk. For more details on Object Risk, see Understand the Data Risk Calculations.
- Total Objects. The total number of objects identified in the service. The data count will vary based on the selected filter.
- Total Data. The total volume of the data discovered in the service. The data count will vary based on the selected filter.
- Object Distribution. The number of objects distributed between CASB and Web applications.
- Classifications. The total number of classifications associated with the service. The classifications count will vary based on the selected filter.
- Users. The total number of users interacting with the service. The users count will vary based on the selected filter.
- Sub-Category. The Cloud Registry category for the service.
Click any service to view the detailed information of the selected service. For details, see Services Detail Card.

Users Tab
The Users table provides the following information:
- Users Count. The total number of users identified in the organization. The users count will vary based on the selected filter.
- User. The name of the user.
- Object Risk. Color codes represent the risk distribution of objects accessed by users: Green indicates low risk, Yellow indicates medium risk, and Red indicates high risk. For more details on Object Risk, see Understand the Data Risk Calculations.
- Services. The name of the service that the user has interacted with.
- Total Objects. The total number of objects accessible to the user. The data count will vary based on the selected filter.
- Total Data. The total volume of the data discovered in the service. The data count will vary based on the selected filter.
- Object Distribution. The number of objects distributed between CASB and Web applications.
- Last Observed. The date and time when the user last interacted with the data.
Click any user to view the detailed information of the selected user. For details, see Users Detail Card.

Chart View
The Chart View serves as a dynamic visual dashboard for monitoring data security posture. It aggregates critical data points into one interface, offering an immediate snapshot that includes total data volume and object count. The Chart View provides detailed visuals illustrating object distribution based on:
- Risk Levels (High, Medium, Low)
- Object Types (Document, Presentation, Spreadsheet, Archive)
- Detection Mechanisms (Forward Proxy, API, Email, RBI)
- Application Type, i.e, CASB or Web applications
The Chart View is designed as a primary monitoring and triage tool to empower the Security Operations Center (SOC) and compliance team with proactive insights into potential data loss and compliance risks. It includes:
- Filters. Allows for the selection of a primary filter category first, followed by the choice of specific options within that category. This organized structure provides enhanced visibility and facilitates quick data discovery to pinpoint the exact data you need in seconds. For example, you can use the Filters to drill down into specific services or high-risk users. Then the SOC can:
- Prioritize incident response
- Perform forensic analysis on specific object types
- Understand which detection mechanisms are most effective at catching sensitive data exposures
- Tables (Riskiest Classifications, Services, and Users) and Top 10 Risky Objects. These immediately highlight high-priority threats, compromised accounts, users, or services requiring urgent investigation.
- Risk Distribution Charts. Quickly grasp the overall severity and nature of policy violations.
Furthermore, drilling down into the Tables and Top 10 Risky Objects sections reveals the specific factors that contributed to the risk assessment. This level of detail is essential for a comprehensive analysis, allowing for a deeper understanding of an object's behavior, potential security implications, and overall impact on the system, thereby enabling informed decision-making and appropriate action.

The Chart View provides the following information:
- Filters. Select options on the Filters tab to narrow your search based on the available parameters, such as Classification, Users, Services, Risks, Object Name, and Digest/Hash. You can switch between Table View and Chart View. Note that the filters remain effective regardless of the view you choose.
- Three-dot menu (). Click to narrow your search with more filters, such as Service Category, Object Type, and Classification Category.
- Three-dot menu (
- Classifications table. The table displays the top 20 risky classifications ranked by total data volume and risk distribution of objects among these classifications. This provides valuable insights into which sensitive data has been edited or moved, with risk distribution to highlight any unauthorized access attempts or unusual usage patterns. Click any classification to view the detailed information of the selected classification. For details, see Classifications Detail Card.
- View all. Click to view all risky classifications available in the system from the Table View > Classifications tab.
- Services table. The table displays the top 20 risky services, ranked by total data volume and risk distribution, along with the object distribution among these services. This provides insights into where sensitive data is located and helps identify vulnerabilities within specific applications. Click any service to view the detailed information of the selected service. For details, see Services Detail Card.
- View all. Click to view all risky services available in the system from the Table View > Services tab.
- Users table. The table displays the top 20 riskiest users, ranked by the total number of accessed objects, with their risk distribution. It also details the specific services accessible to each user and the total volume of data they can access. This provides insights into who is accessing data, the volume of accessible data, and the services that are exposed to risk. Click any user to view the detailed information of the selected user. For details, see Users Detail Card.
- View all. Click to view all risky users available in the system from the Table View > Users tab.
- Total Data and Objects. The aggregated snapshot of the dataset provides:
- DATA. The total volume of the data measured in units like GB, TB, or PB shows aggregate storage size and data growth in the organization. The data count will vary based on the selected filter.
- OBJECTS. The total count of discrete data items (documents, images, videos, database records, log entries, etc.) captured in the organization. The object count will vary based on the selected filter.
- Top 10 Risky Objects. The top 10 risky objects in the system that may pose a potential security threat. This can include suspicious files, compromised accounts, misconfigured network devices, and more. Click any object link to view the detailed information of the selected object. For details, see Objects Detail Card.
- Object Risk Distribution. The aggregated number of objects at risk, along with the risk deviations categorized by High Risks (red), Medium Risks (yellow), and Low Risks (green), with their respective object counts. For more details on Object Risk, see Understand the Data Risk Calculations.
- Distribution by Object Type. The percentage distribution of various object types within the dataset includes Document, Spreadsheet, Presentation, Archive, and other categories.
- Object distribution by Detection Mechanism. The percentage of object distribution based on the detection mechanism, such as Forward Proxy, Email, API, Private Access, and RBI.
- Object distribution. The percentage of objects distributed between CASB and Web applications.
- Distribution by Object Size. The distribution of objects based on size and the number of files corresponding to each size.