Configure File System Usage Monitoring
Introduction
This document focuses on hard drive usage (disk space) for the Skyhigh Security Web Gateway and the best practices for monitoring it. Our primary focus will involve the /opt partition on your Skyhigh Security Web Gateway.
It is important to monitor the /opt partition as this is where the SWG ({corp}} Web Gateway) software is installed. Also the SWG processes utilizes the /opt partition as a temporary work space, to store user-defined logs, and troubleshooting/debug files. A full /opt partition will cause a negative impact on your appliance.
A /opt partition that is full can result in the following symptoms:
- Failure to access SWG’s User Interface (UI)
- Failure to save changes while in UI
- Unable to pass web traffic through the proxy
- Other permission issues as SWG is prevented from writing to the /opt partition’s filesystem.
How do I monitor the /opt partition?
There are a number of ways to monitor the /opt partition. A best practice for monitoring /opt is to configure alerts to trigger when /opt usage reaches a specific threshold. This can help you avoid problems before they happen. Below are some of our recommended methods to trigger alerts:
Incident IDs
Dashboard alerts are presented when the /opt partition usage exceeds 90%.
Every dashboard alert equates to something called an Incident ID. An Incident ID can be used as criteria to trigger events such as an Email Notifications, syslog, etc. so that the Administrator can be warned about the event before a bigger problem can occur. The Incident ID used when /opt partition usage exceeds 90% is Incident ID 22. Please see this community article for best practices when monitoring based on Incident IDs:
Statistical Counters
Statistical counters are another method that you can use to monitor your /opt partition. There are many different statistical counters available. In this case we will be dealing with the counter called ‘FileSystemUsage’. The main benefit of this method is that you can set the threshold for the counters you are monitoring. Instead of only triggering an email notification when /opt is 90% utilized like above, you can now tweak this to a value that better suits your organization.
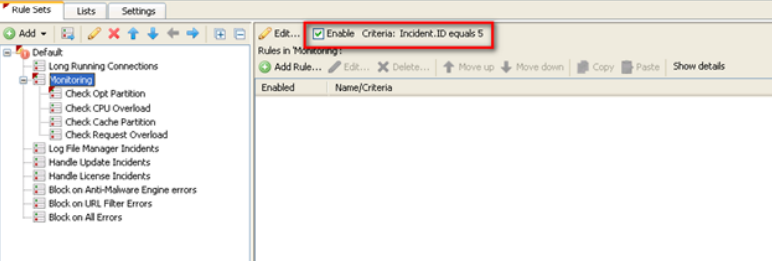
Statistical counters are monitored are through a special Incident ID (5). This “incident” is intended to be just a trigger. Incident ID 5 is calling the error handler once every minute and can be used to trigger checks. In this example, we use it to monitor our statistics counter (FileSystemUsage).

How do I create a rule to monitor and send alerts?
Creating a rule to monitor and send alerts involves a few steps. The rules are created in the monitoring rule set which is located in Policy > Rule Sets > Error Handler > Default > Monitoring rule set. The rule will include:
Criteria to Enter the rule
Building a notification message
Configuring alerts to use the notification message
Criteria for Monitoring rule set
Incident.ID equals 5
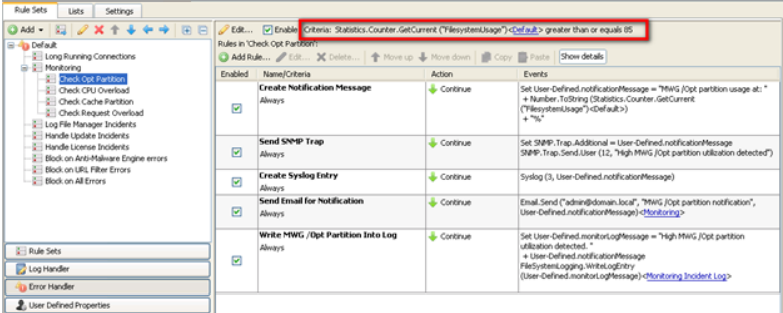
Criteria for Opt Partition Rule Set
“Statistics.Counter.GetCurrent (“FilesystemUsage”)greater than or equal 85”.
Building a notification message
Build a notification message called User-Defined.notificationMessage. As an example this notification message will contain “SWG /Opt partition usage at: 87%” when usage is 87%.
Add an alert that uses the notification message
Build an email alert that uses the notification message by adding an event to the rule. Notice that the email body uses the same notification message created above.
The example below has a rule to create the notification message and 4 alert rules (SNMP, syslog, email, and log file)

The example below has a rule to create the notification message and 4 alert rules (SNMP, syslog, email, and log file)

I received an alert, what do I do?
Time is critical so you will want to identify and correct the problem as soon as possible.
- Log into the Appliance with an SSH client using the ‘root’ user account.
- Open the SSH client.
- In the Host section, type the IP address of the Web Gateway Appliance.
- Click Open.
- Run the command below to review disk usage on /opt:
df -h
This will help to confirm the alert message you received
3. Next, run:
du /opt -Dm | sort -n|tail
This will find the largest folders on /opt and output the results in ascending order based on MB.
- The example below shows that a cores directory is using approximately 8GB of disk space due to four core files.
- If you’re not able to determine the source of the problem, please create a listing for your support representative. You can run this command to output a .txt file with a directory listing:
du /opt/ -Dm|sort -n > opt_directory_listing.txt
Attach ‘opt_directory_listing.txt’ to your open Service Request email.
Common causes, Preventative measures, and file locations
Common reasons the /opt partition would run out of space:
- User-defined logs. Logs like the access.logs and access_denied.logs, are located in the /opt/swg/log/user-defined-logs directory and sub directories.
To prevent partition utilization issues you should setup an appropriate rotation, deletion, and push schedules for the logs located in Policy > Settings > Engines > File System Logging. Additionally, it is a best practice to enable the setting “GZIP log files after rotation”.
- Tracing files. These are located in the /opt/swg/log/debug directory or subdirectories. Some example debug file locations are:
/opt/swg/log/debug/connection_tracing
The /opt/swg/log/debug/ directory also contains the authentication trace, quota trace, PD storage trace, log manager trace, and coordinator trace files.
To prevent partition utilization issues these files should only be created just prior to testing and then disabled/stopped after the testing has completed. Many of the debugs tracing options allow restricting the logging to one test IP address. It is our recommendation that you do this to limit the amount of information generated.
NOTE: Connection tracing files will be removed on reboot or restart of the service. It is still recommended to manually remove the files and/or disable the tracing immediately after.
- Temporary files. These files are located in the /opt/swg/temp directory. It is normal for SWG to create swg-core temp files in this directory while it is downloading and scanning files. If this directory is the source of your disk space usage on /opt, it could be that many large files are being downloaded at that time.
These files are managed by the swg-core process and are removed after download/scanning has completed.
NOTE: Streaming Media files that are scanned by AV can cause very large temp files as streams have no known end. It is recommended that these files be bypassed from scanning by the Streaming Detector.
- Support Files. Support may request additional troubleshooting files for review.
/opt/swg/log/debug/tcpdump
/opt/swg/log/debug/feedbacks
/opt/swg/log/debug/cores
NOTES:
- After support has ensured the receipt of these files, you may remove these files from your system.
- Core files have a deletion schedule which is define under Configuration > Appliances tab > Log file manager> Advanced.
