Understand HTTP 502 status codes
Overview
The Hypertext Transfer Protocol (HTTP) uses RFC 2616 (http://www.ietf.org/rfc/rfc2616.txt) to define numeric status codes used by HTTP servers and proxies to communicate to a client the successful transfer, block or status of a request.
This topic focuses on one of these status codes: HTTP 502. The 502 message is used by the Web Gateway to alert a client that a connection to the destination could not be established or that the destination provided an invalid response. This will usually result in the client getting a block page from the Web Gateway and this topic will focus on three of the more common block messages that are seen; Host Not Resolvable, Bad Response and Cannot Connect.
We’ll first focus on how to identify a 502 block and then step through a few common examples illustrated with Wireshark captures. The last section will deal with gathering a tcpdump from Web Gateway for review in Wireshark.
Although the topic will focus on 7.x, much of this will also be applicable to version 6.x as well.
Identifying
These errors are usually easy to identify as a block page will be displayed in a client’s browser. The three that this document deals with are below:
Host Not Resolvable
For details, see Host Not Resolvable.
Cannot Connect
For details, see Cannot Connect.

All three of these blocks will log a HTTP 502 Status in the Web Gateway access logs:
[08/Mar/2013:18:25:57 -0600] "" 10.10.67.4 502 "GET

http://example.local/ HTTP/1.1" "" "-" "" 3126 "Mozilla/4.0(compatible; MSIE 8.0; Windows NT 5.2; Trident/4.0; .NET CLR1.1.4322; .NET CLR 2.0.50727; .NET CLR 3.0.4506.2152; .NET CLR3.5.30729; .NET4.0C; .NET4.0E)" "" "0"
Host Not Resolvable
This message will be displayed if Web Gateway is unable to contact the DNS server or if the DNS server returns a “No Such Name” response as seen in the example below. The filter used to display this was “(ip.addr==10.10.67.4 && (http.response.code==502||http.request)) ||dns”.

In this case we can see the client (10.10.67.4) makes a request to the Web Gateway (10.10.67.161) on its default proxy port 9090. After Web Gateway receives the request it must perform a DNS query to resolve the hostname to an IP address and contacts the DNS server (10.10.65.1), requesting the IP address of example.local. Packets 74 and 76 show the request and packets 75 and 77 show the response.
To fix this issue the DNS would need to be configured with an “A” record for example.local. A workaround could also be put in place on the Web Gateway’s hosts file. This would allow Web Gateway to resolve the hostname to an IP address without the need of a DNS Query. The hosts file can be edited on version 7.x under Configuration > File Editor > hosts.
Bad Response
This message is displayed in two common scenarios; If the Web Gateway receives a response from the destination but the response is not a valid HTTP response or if it does not receive a response at all within the default two minute timeout.
The filter used to display the behavior below was “(ip.addr==10.10.67.4 ||ip.addr==10.10.67.124) && (http.request|| http.response)”.

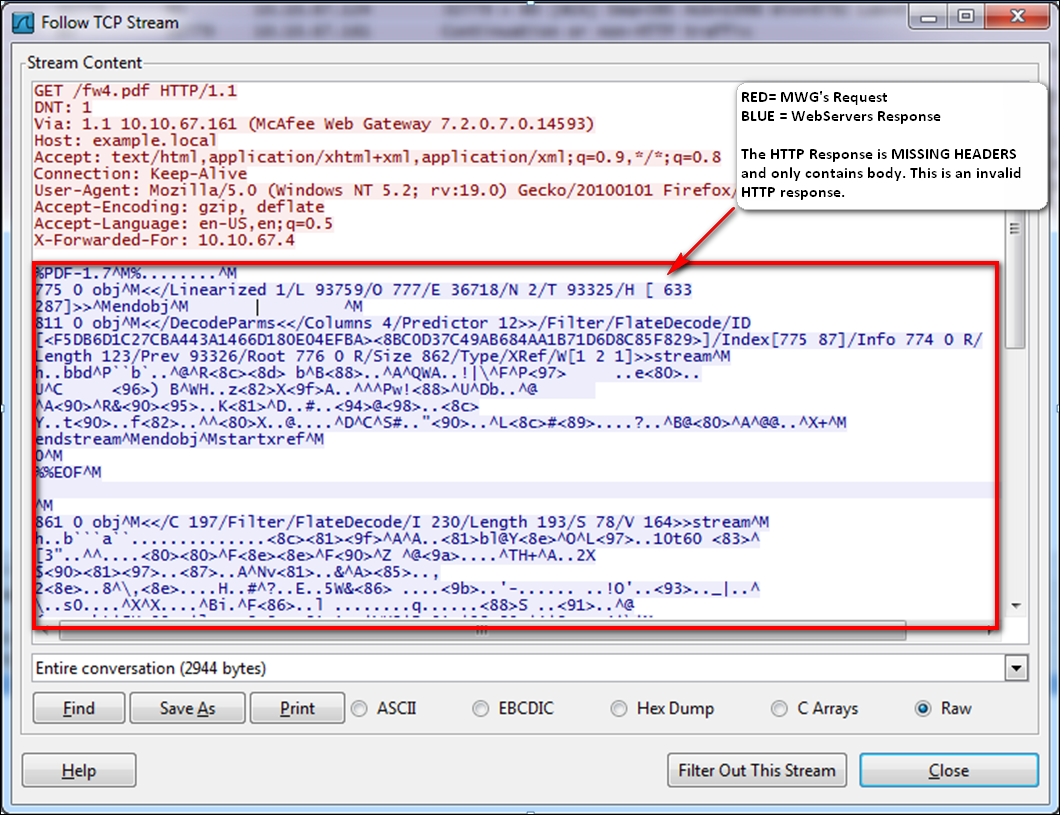
The filter displays all HTTP requests and responses between the client (10.10.67.4), Web Gateway (10.10.67.161) and the destination (10.10.67.4). With it applied we can see the client request the URL http://example.local/fw4.pdf and in packet 41, we see the Gateway proxying the request to the destination. In packet 249, we see what looks to be initially a good response to the client (HTTP/1.0 200 OK) but then it is followed by 502 badgateway message. Notice that there is no 200 OK response from the server displayed. We can look closer into the server connection by right clicking packet 51 and selecting Follow TCP stream to reveal:
Invalid HTTP Response (missing HTTP Headers)

Here we see the request made by Web Gateway in red and in blue is the response from the destination. The destination sends an invalid HTTP response– RFC standard requires that an HTTP status code be sent with each response. For example, “HTTP/1.0 200 OK”.
Behavior like this can be caused by devices upstream from the Web Gateway or by destination servers that are unable to send a valid responses. Packet captures should be taken on the next upstream device while running a simultaneous packet capture on the Web Gateway to trace the behavior back.
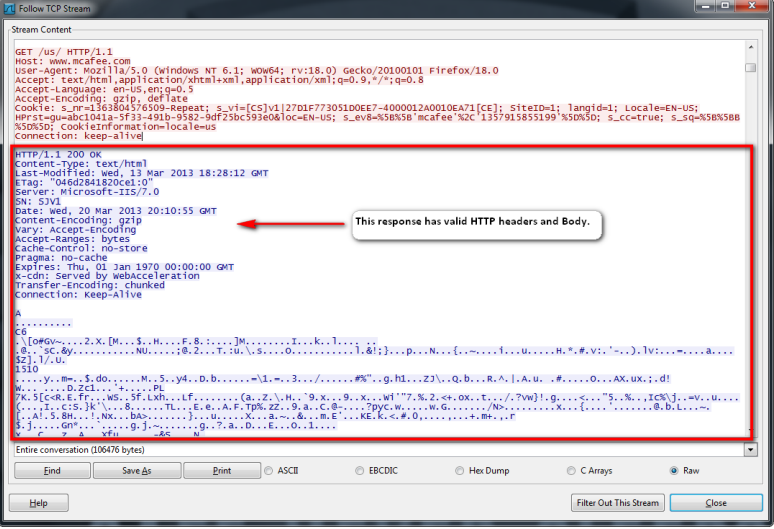
Valid HTTP Response
For comparison, below is an example of a good HTTP response:

Timeout Exceeded
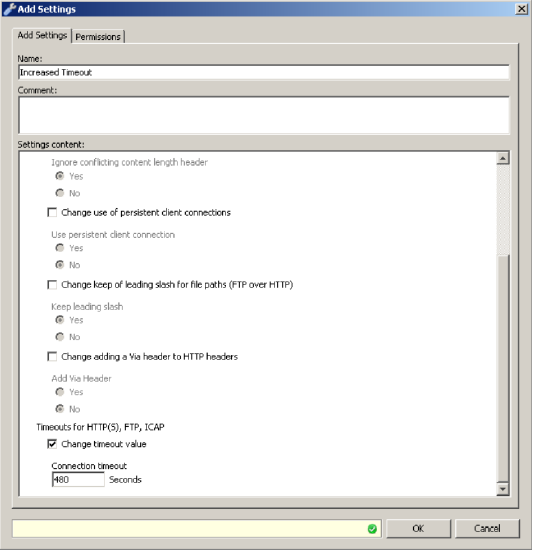
In some cases the site that the Web Gateway is contacting needs more time than the default two minutes to return a response. For example, the client is attempting to generate a report on a web site and the site needs more than two minutes to compile and return report results. In situations like this, Web Gateway can be configured to use a Proxy Control event to increase the timeout.
The timeout is increased by creating a new settings container under Policy > Settings > Engines > Proxy Control. In the image below, the timeout is increased from 120 seconds to 480 seconds.

The timeout is then applied to specific hosts using the URL.Host property and and Proxy Control event.
Cannot Connect
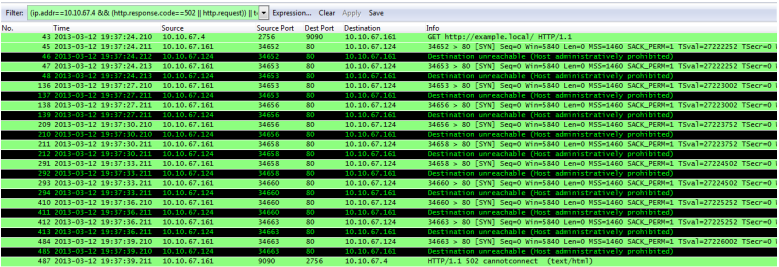
Each connection the Web Gateway makes to a destination begins with a TCP three-way handshake. This handshake must occur before the Gateway can send the HTTP request and if it fails then it will result in the “Cannot Connect” message. The examples below first shows theinitial client request to the Gateway and in the next packet we can see the Gateway sending the first part of the handshake (SYN) to the destination. Each of the examples uses the same display filter to display the behavior:
(ip.addr==10.10.67.4 && (http.response.code==502 || http.request)) || (ip.addr==10.10.67.124 && tcp.port==80)
SYN without a response
After the initial client connection sent in packet 34, Web Gateway tries to establish a connection to the destination by sending a SYN packet. Normally we would expect to see a SYN/ACK packet sent back from the client but in this case nothing is received and after 3 seconds the Gateway sends another SYN packet. The Gateway repeatedly continues to increase the wait time before sending another SYN packet until in packet 3310 it gives up and sends the 502 back to the client because a TCP connection to the destination could not be established.
RSTing the connection

Packets 828, 830, 833, etc… all show that the Web Gateway is receiving a RST (Reset) packet after each SYN packet it sends. The RST packet is used to terminate a connection. Since Web Gateway is unable to establish a TCP connection to the destination a “Cannot Connect” message is sent back to the client.
ICMP alerts

Packets 46, 48, 137, etc… all show that the Web Gateway is receiving a “Destination unreachable (Host administratively prohibited)” message after each SYN packet it sends. A “Cannot Connect” message is sent back to the client because a TCP connection cannot be made with the destination.
The most common cause for the messages is presence of a firewall between the Web Gateway and destination that is either configured to actively deny connections from Web Gateway to the destination or to simply drop the packets like in the case of the unanswered SYN packets. The destination could also be configured to actively block or passively ignore these connections.
To troubleshoot these issues it should be verified that the service is available when not accessed through the Web Gateway. Ideally the test should be done from the same network as the Web Gateway. If the service is available then the problem lies between Web Gateway and the destination and a packet capture should be taken on the next upstream device while simultaneously running another trace on the Web Gateway.
Routing may also be an issue wherein the packets from the Web Gateway may not be routed correctly to the destination or the response packets may not be routed back to the Web Gateway. A ping or trace route test from the Web Gateway can be performed under Troubleshooting > Network Tools to confirm routing. If routing is suspected to be the problem then Web Gateway’s default gateway and static routes should be examined along with any routers upstream of the Web Gateway.
Gathering a tcpdump from Web Gateway
To begin troubleshooting a 502 we first need to gather a packet capture taken while the issue is reproduced. The best place to gather the capture is on the Web Gateway. On version 7.x this can be done either on the command line using the tcpdump command or from the GUI under Troubleshooting > Packet tracing.
The command to run from the command line should be similar to this:
tcpdump -s 0 -i any -w filename.pcap
The “-s 0” option allows tcpdump to collect data without truncating it and the “-i any” option captures traffic on all interfaces. This is generally the best way to run the capture at first unless you know exactly what behavior is expected, which hosts are involved, etc. The “-w” option is used to write the traffic to a file so that it can be opened by the Wireshark tool.
If the trace is being gathered from the GUI then you will only need the parameters “-s 0 –i any” as the GUI will automatically write the traffic to a file.
It is important to only allow these traces to run just long enough to capture the behavior as they can grow very rapidly and the GUI will only be able to capture 200000(~150 megs) packets before automatically stopping. Once the behavior is reproduced, use CTRL+C to stop the tcpdump or the “tcpdump stop” button to stop the capture.
The file can then be transferred from the Web Gateway to a client machine for review with the wireshark tool. The wireshark tool is a free packet analyzer available at wireshark.org and is used in the samples above to display the traffic.*
The Web Gateway 502 messages are caused by a failure to communicate with an upstream device, so we must first locate the client’s request and the 502 response it receives and examine the traffic in between. The client’s traffic can be found with the display filter:
ip.addr==a.b.c.d && (http.response.code==502 || http.request)
Where a.b.c.d is the ip address of the client. This will display all requests made from the client and any 502 messages they received. The request that trigged the 502 response will generally be displayed directly above the packet containing the 502 but you can also right click the 502 response and select the “Follow TCP Steam” option to view the complete request and response and help identify the corresponding packets.
To make large traces easier to handle you’ll want to extract and save all packets between the client’s request and response. Do this using the “Range” field under File > Export Specified Packets.
*To make the proxy communication between Web Gateway and the client readable, Wireshark needs to be configured to decode traffic on the proxy port (default 9090) as HTTP. This can be done by adding the proxy port to the “TCP Ports” field found in Wireshark under Edit > Preferences > Protocols > HTTP.

