Skyhigh Security Cloud Release Notes 6.5.1 (Dec 2023)
|
Legends used: General Availability |
Skyhigh Cloud Platform
Skyhigh Data Loss Prevention (DLP)
Enhanced UI for Custom Advanced Patterns Regex & Ignored Expressions 
To view the enhanced UI for Custom Advanced Patterns, go to Policy > DLP Policies > Classifications > Actions > Create Classification > Advanced Patterns > New.
| Old UI | Enhanced UI |
|---|---|
|
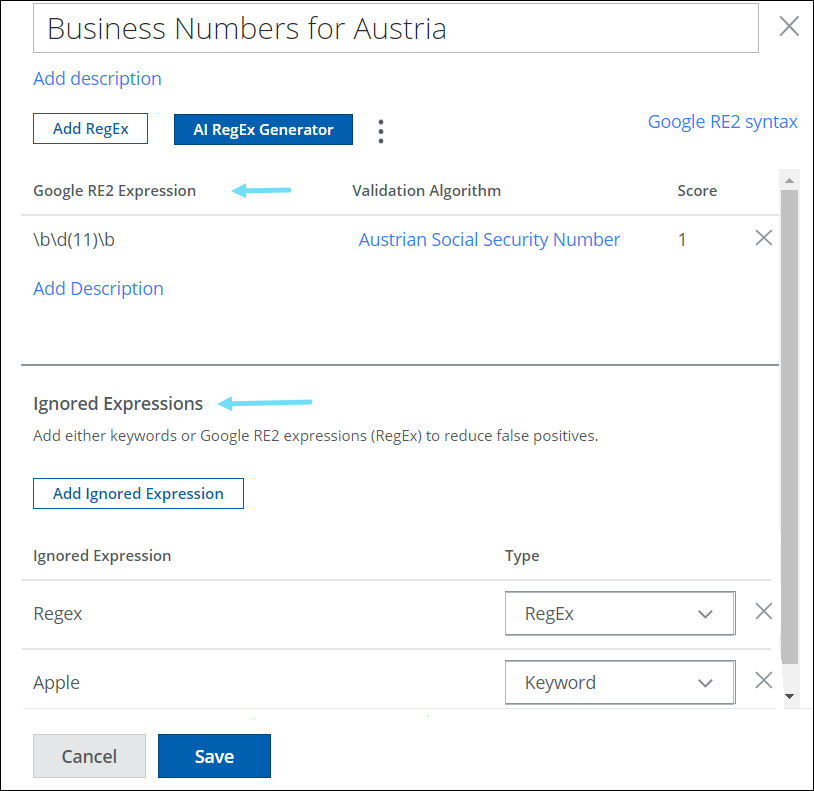
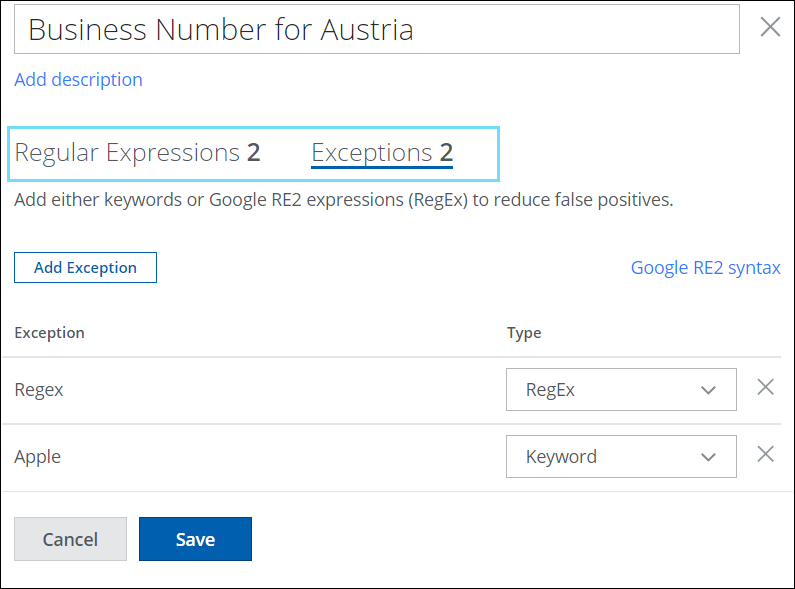
The old user interface for Regex and Ignored expressions was presented in a manner that required extensive scrolling through layered views. As a result, users found this approach to be cumbersome and time-consuming to navigate and manage.
|
To enhance the usability of Regex and Ignored Expressions, the UI has been redesigned to include a Tabular View for both Regex and Ignored Expressions. Ignored Expressions are now called Exceptions in the Tabular View. Regular Expressions and Exceptions tabs display the number of regex patterns/exceptions added to your custom Advanced Pattern. These changes aim to simplify the use of Regex and Ignored Expressions, reducing false positives for users. For details, see Create Custom Advanced Patterns and AI RegEx Generator for Custom Advanced Patterns. |
Data Jurisdiction for Policy Incidents
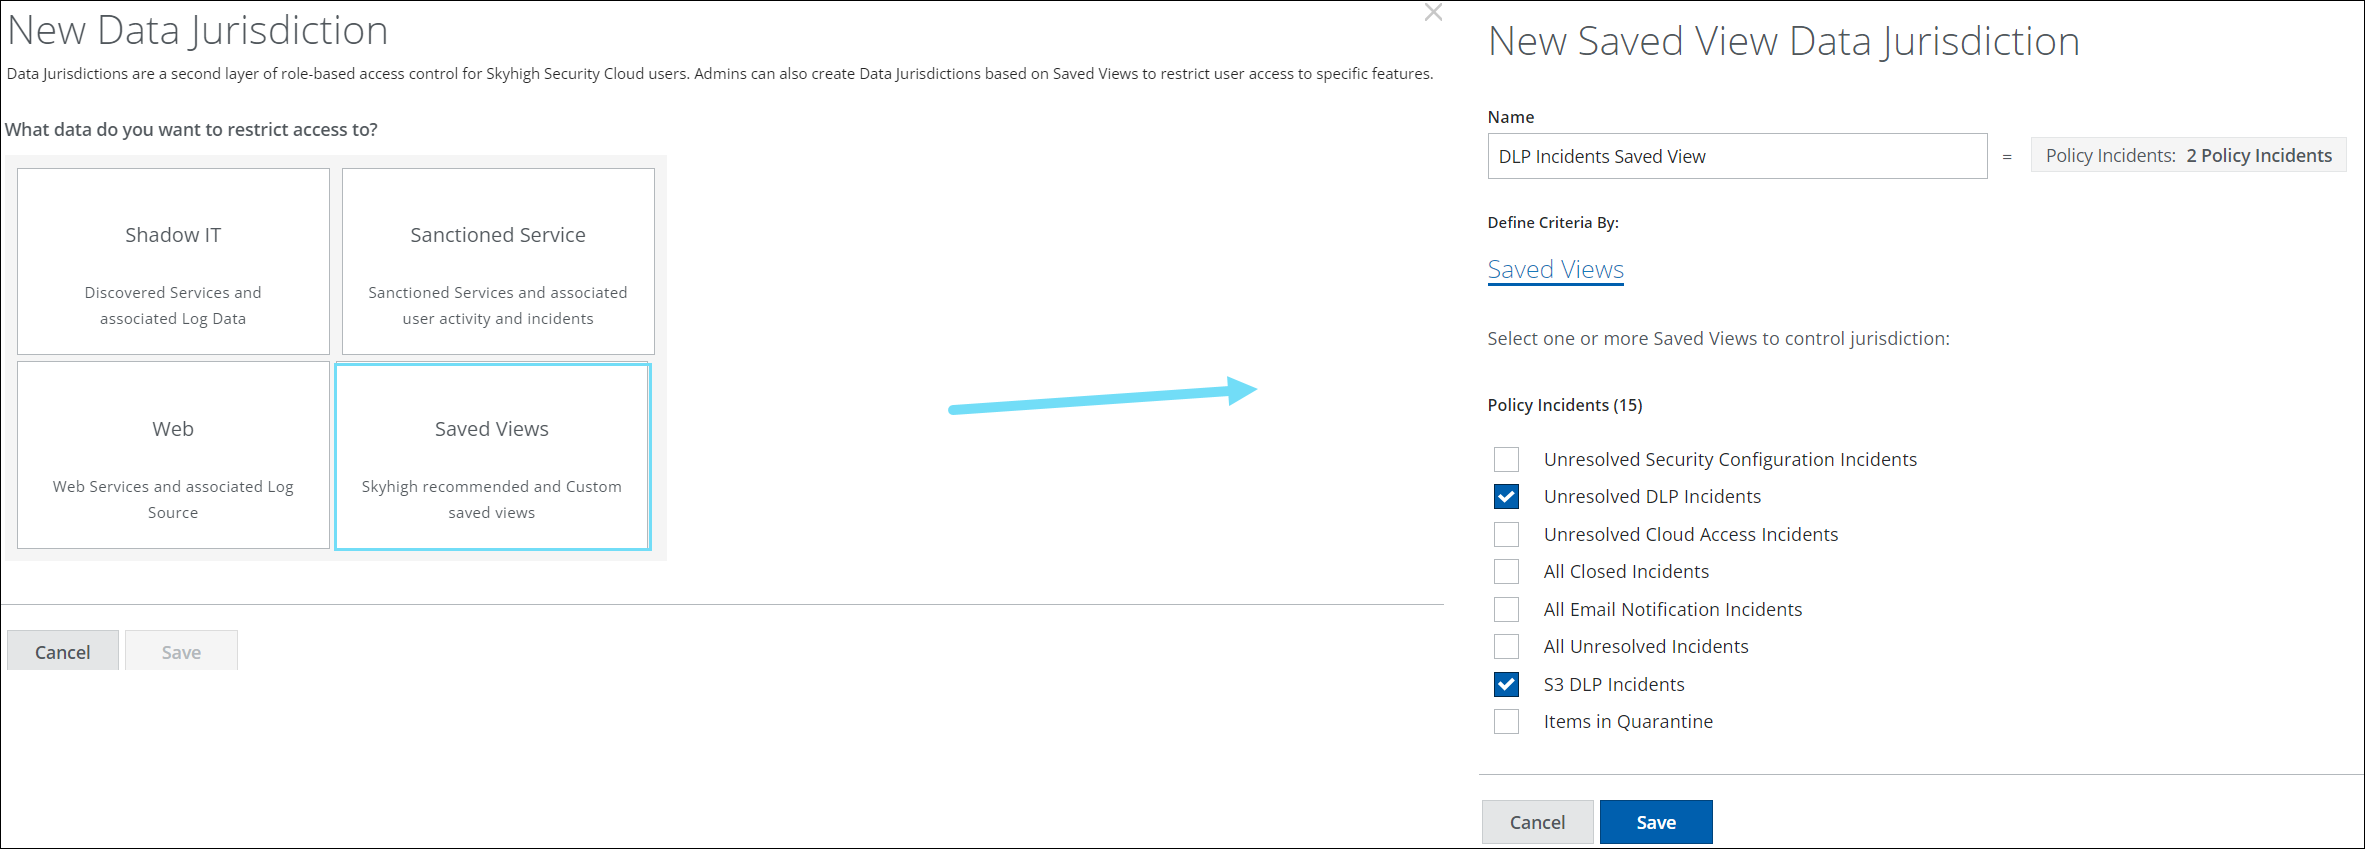
Saved View Data Jurisdictions are a second layer of role-based access control for your Skyhigh Security Cloud users. You can restrict the access of users to a specific Saved View in the Policy Incidents using data jurisdiction. You can define the jurisdictional boundaries using either Skyhigh recommended or your own Custom Saved Views. This ensures that any users within the tenancy can access the data in the desired Saved View, providing an extra level of security.
For example, A SOC could restrict access to the DLP incidents on the Policy Incident pages by using Data Jurisdiction. To achieve this use case, create a saved view by selecting the desired DLP incidents, create a saved view data jurisdiction based on that saved view, and then assign that data jurisdiction to a designated SOC to only see those incidents. For details, see About Data Jurisdiction and Create Data Jurisdictions for Saved View.
Other DLP Improvements
Query Incidents API with File Name or File ID 
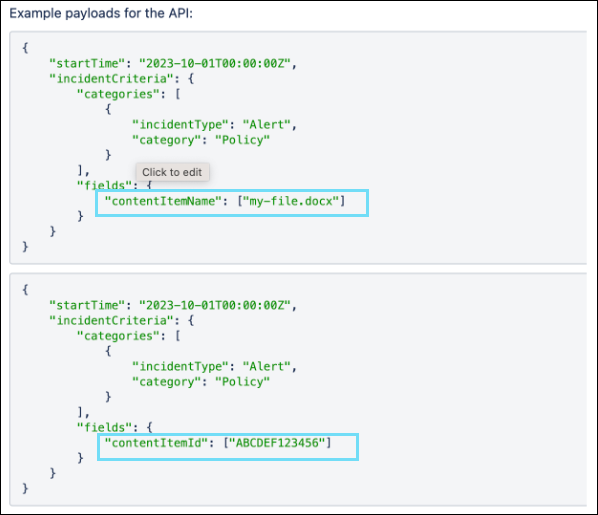
You can now query the Incidents API with the specific File Name or File ID. The Incidents API allows you to filter incident criteria fields based on contentItemName or contentItemId. This enables DLP SOC admins to take remediation action quickly and efficiently for incidents related to a specific file or file ID and improve their workflow and response time. This feature ensures incidents are identified and resolved more promptly, reducing the risk of data breaches and minimizing the impact on the organization. For details, see Incident API Definition.
Bulk Incidents Remediation Status Bars
When you perform bulk remediations for the incidents simultaneously on the Policy Incidents page, the status bar provides users with a visual indication of the progress of the bulk action. This feature helps to provide feedback to the users on the progress of the bulk update and helps them determine when the operation will be completed. Using status bars can reduce user perception of time, making the process smoother and more efficient. Based on the user's bulk action status, the Policy Incidents page displays the following status bars :
- Progress Bar. It indicates the number of incidents currently being processed with the percentage of progress.

- If the bulk update is in progress, the new bulk actions are disabled until the update is complete. You need to wait for a few minutes to start new bulk actions.

- Error Bar. It indicates the number of incidents that failed to process during the bulk remediation. To check the failed incidents, filter the facets, and retry the bulk remediation process.

- Completion Bar. It indicates the number of incidents that have been remediated with the percentage of completion. For details, see Bulk Incidents Remediation.

Skyhigh SSE Products
Skyhigh Secure Web Gateway Cloud
Rule Set for Blocking the Transfer of User Data to ChatGPT
You can block the transfer of data that originates when users of your organization access the web to the ChatGPT artificial intelligence (AI) application. You can configure this blocking as part of your web policy. A library rule set is provided for this purpose.
For example, when configuring the rules of this rule set, you can disable training on chat history for ChatGPT. This user data cannot be shared to ChatGPT then.
To implement this rule set, you import it from the rule set library, where it can be found under Application Control. We recommend that you also place it in this rule set group within your configuration.

After importing it, you can configure the rules of this rule set as needed.
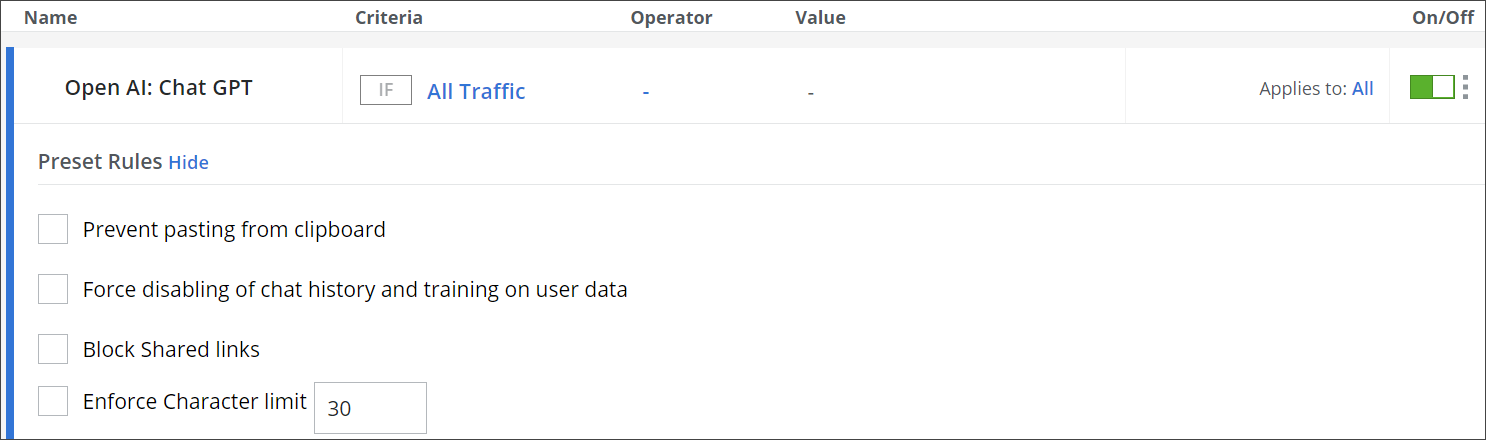
For more information, see Open AI: Chat GPT — Block Transfer of User Data to ChatGPT.
Disabling the Browser Isolation Indicator
When you have configured Remote Browser Isolation (RBI) as part of your web policy, a web page where browser isolation is applied is surrounded in the user's browser by a green border. The border indicates that this web security measure is in place.
You can configure this indicator to be disabled. Browser isolation is then still applied, but it is not visible that it is in place.
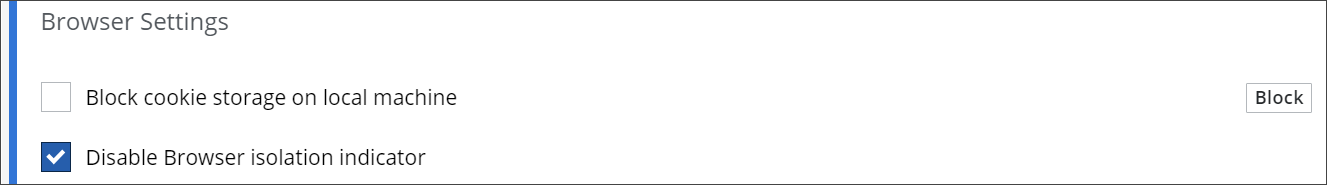
The browser isolation indicator can be disabled in the Risky Web and Full Isolation rule sets for both modes of browser isolation.
For more information, see Risky Web — Use Browser Isolation for Websites Considered a Risk and Full Isolation — Use Browser Isolation for Websites Based on Your Own Selection.
Exporting a Template for an End User Notification Page
An End User Notification Page is sent to user when a request for web access that this user sent is redirected to Secure Web Gateway and impacted by a rule of your web policy, for example, when a request is blocked. To configure End User Notification Pages, you work with templates.
You can export a template from Secure Web Gateway to a location of your own. This function is available on the End User Notification Pages page of the user interface for Secure Web Gateway, where a list of templates is provided.
To export a template, for example, the default Anti Malware template, you click the export icon in the line for this template. It is located under Actions on the far right of this line.

For custom templates, the icon is located next to the last icon.
After clicking the icon, the template is exported to a folder in your file system.
For more information, see Export a Template.
URL Category Displayed as Top-level Column on Web Analytics Pages
On the Web Traffic and Web Users analytics pages, you can view data that provides you with an overview of web traffic that occurred during a configured time range and the users who caused this traffic.
The data is broken down into different categories, for example, the websites that users accessed or the reputation of these websites.
This data includes the URL categories for the websites that were accessed. URL Category is also displayed now as a separate top-level column on the Web Traffic page, as shown here below, and similarly on the Web Users page.
This allows you to create dashboard cards and reports based on URL categories for websites.
For more information, see Web Traffic Page and Web Users Page.
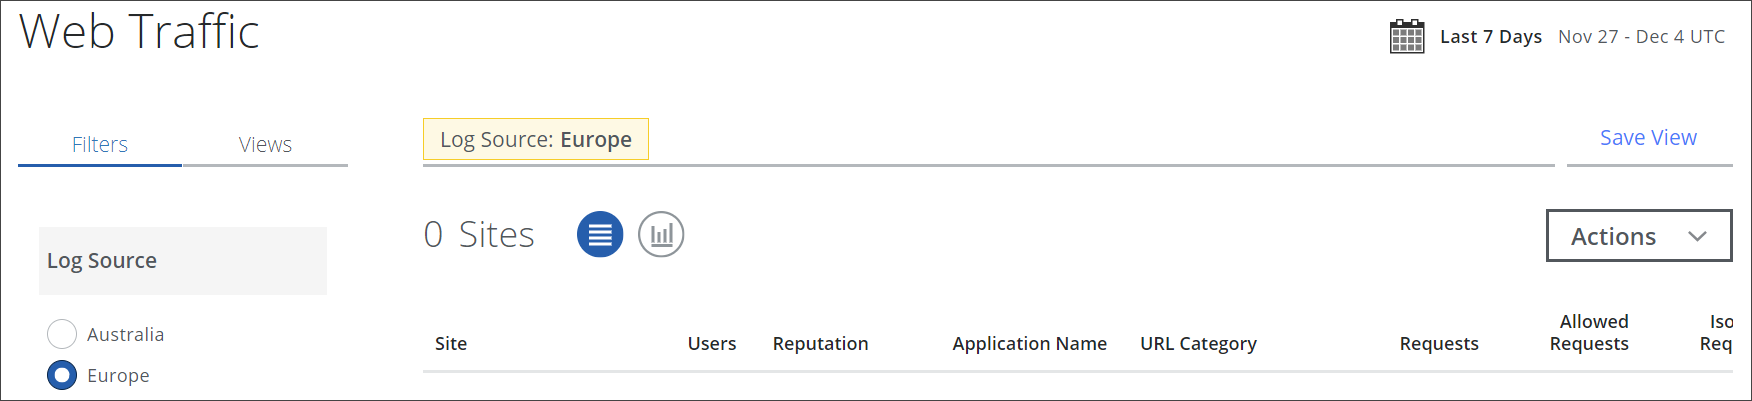
Log Data Fetched from Location Configured for Log Data Residency
When data about web traffic is shown on the user interface, it relates to a particular location that is the log source for this data. This log source is now selected based on the location that you specified when configuring log data residency. The location can be a region or a country.
For example, according to what you have configured, log data about web traffic originating in Europe is also stored there. This region will be the log source for data about web traffic originating in Europe when this data is shown on a dashboard card or in a report.
You can configure log data residency when setting up Secure Web Gateway using the Secure Web Gateway Setup page. Upon clicking Edit in the Log Data Residency section, the Log Data Settings page appears with options for configuring where to store log data.

The configured region is then shown as log source, for example, on a dashboard card that you create.

For more information, see Configure Log Data Residency and Privacy and Use of a Configured Location for Log Data Residency on a Dashboard Card.
Saudi Arabia Added to Locations for Configuring Log Data Residency
When configuring log data residency as part setting up Secure Web Gateway, you can now configure Saudi Arabia as location where log data for a particular region is stored.

For more information, see Configure Log Data Residency and Privacy.
Skyhigh Private Access
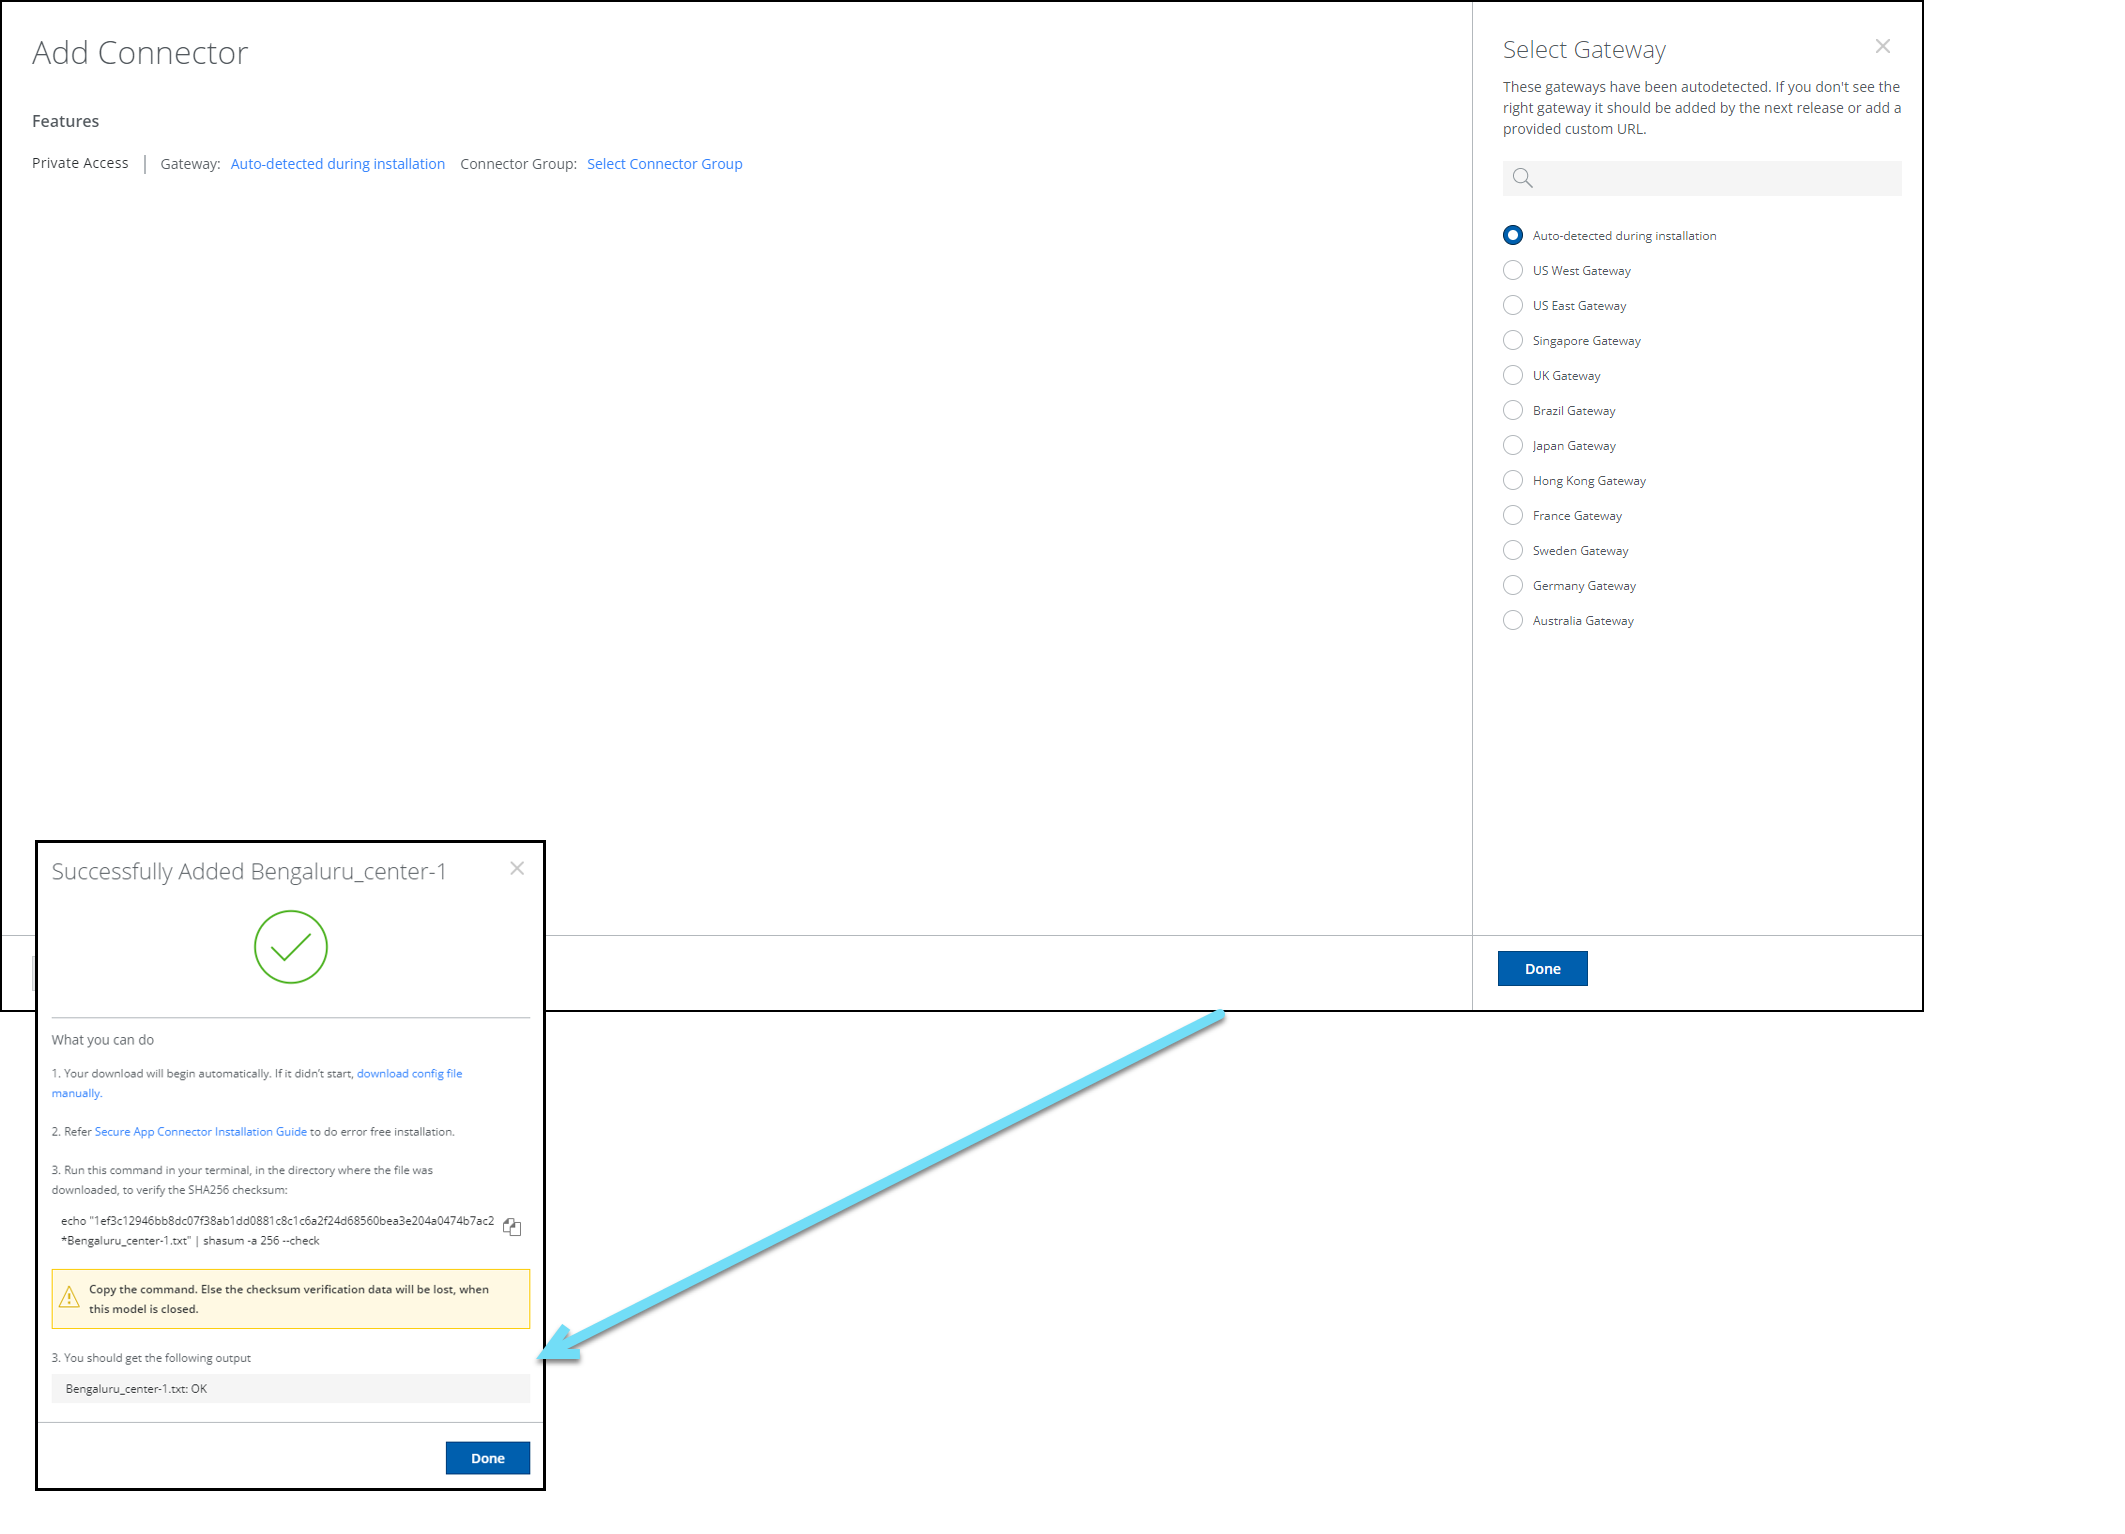
Deploy Secure App Connector V2
NOTE: Menu item for Connector has changed to Secure App Connector.
Using OVA Package
The Skyhigh connector group includes one or more Secure App Connectors, which enables end users to securely connect to their organization's private application via Skyhigh SSE.
The OVA packages are available for the following environments:
- Secure app connector V2 OVA on VMWare VSphere Hypervisor (ESXi)
- Secure app connector V2 OVA on VMWare vCenter
Skyhigh Security provides a new UI workflow to create a connector configuration file required in the connector v2 deployment. Download the OVA package and use the connector configuration file to complete the connector deployment process. For deployment methods, see Deploy Secure App Connector V2 VM. For details on creating a connector configuration file, see Configure Secure App Connector V2
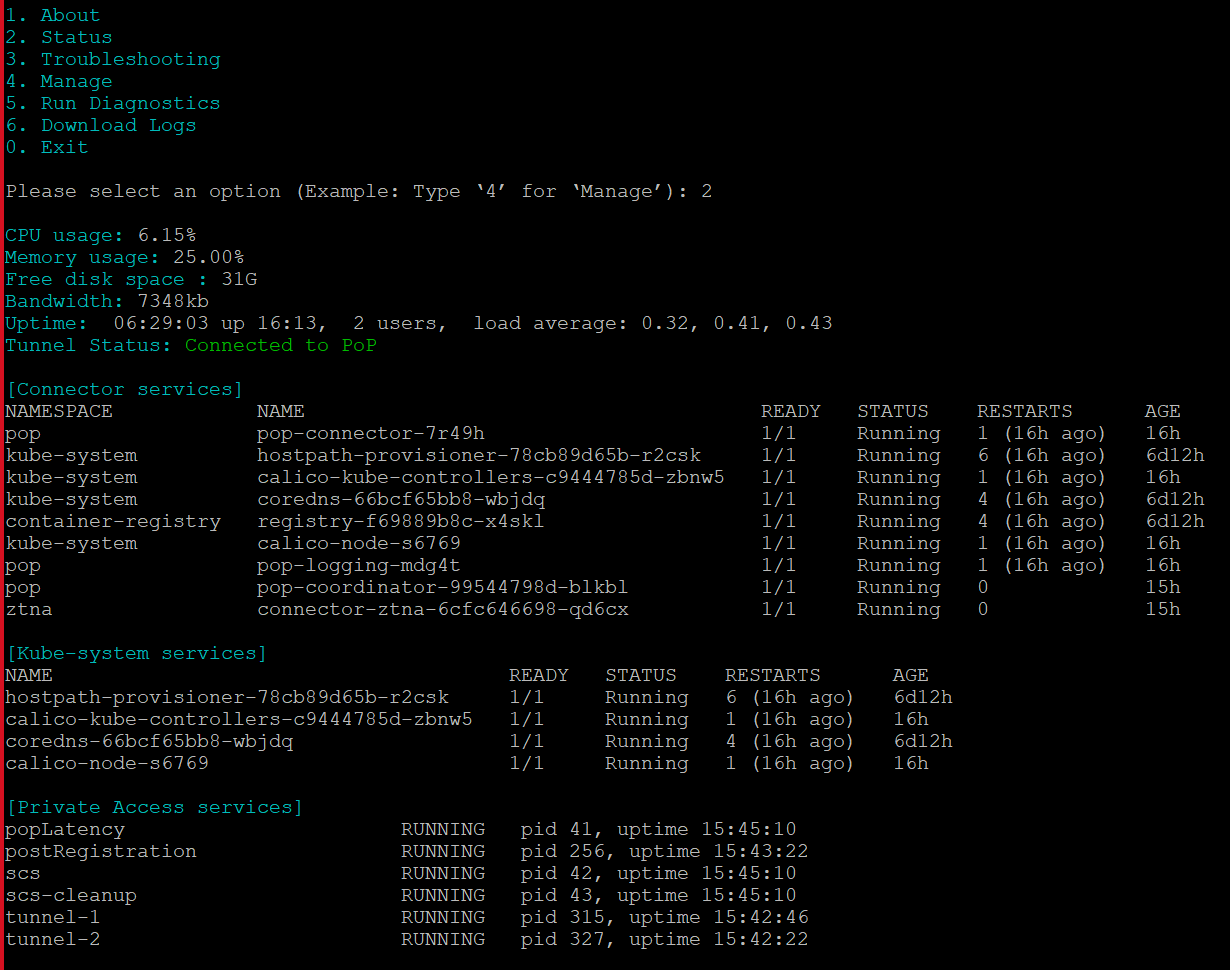
CLI Commands
Connector V2 CLI commands enable you to manage, check the status, run diagnostics, and troubleshoot your secure app connectors.
- Log on to the connector host using SSH (Secure Shell) and execute the required commands to troubleshoot a connector.
- If you are a root user or a non-root user, execute the
pa_connectorscript from anywhere on the host.
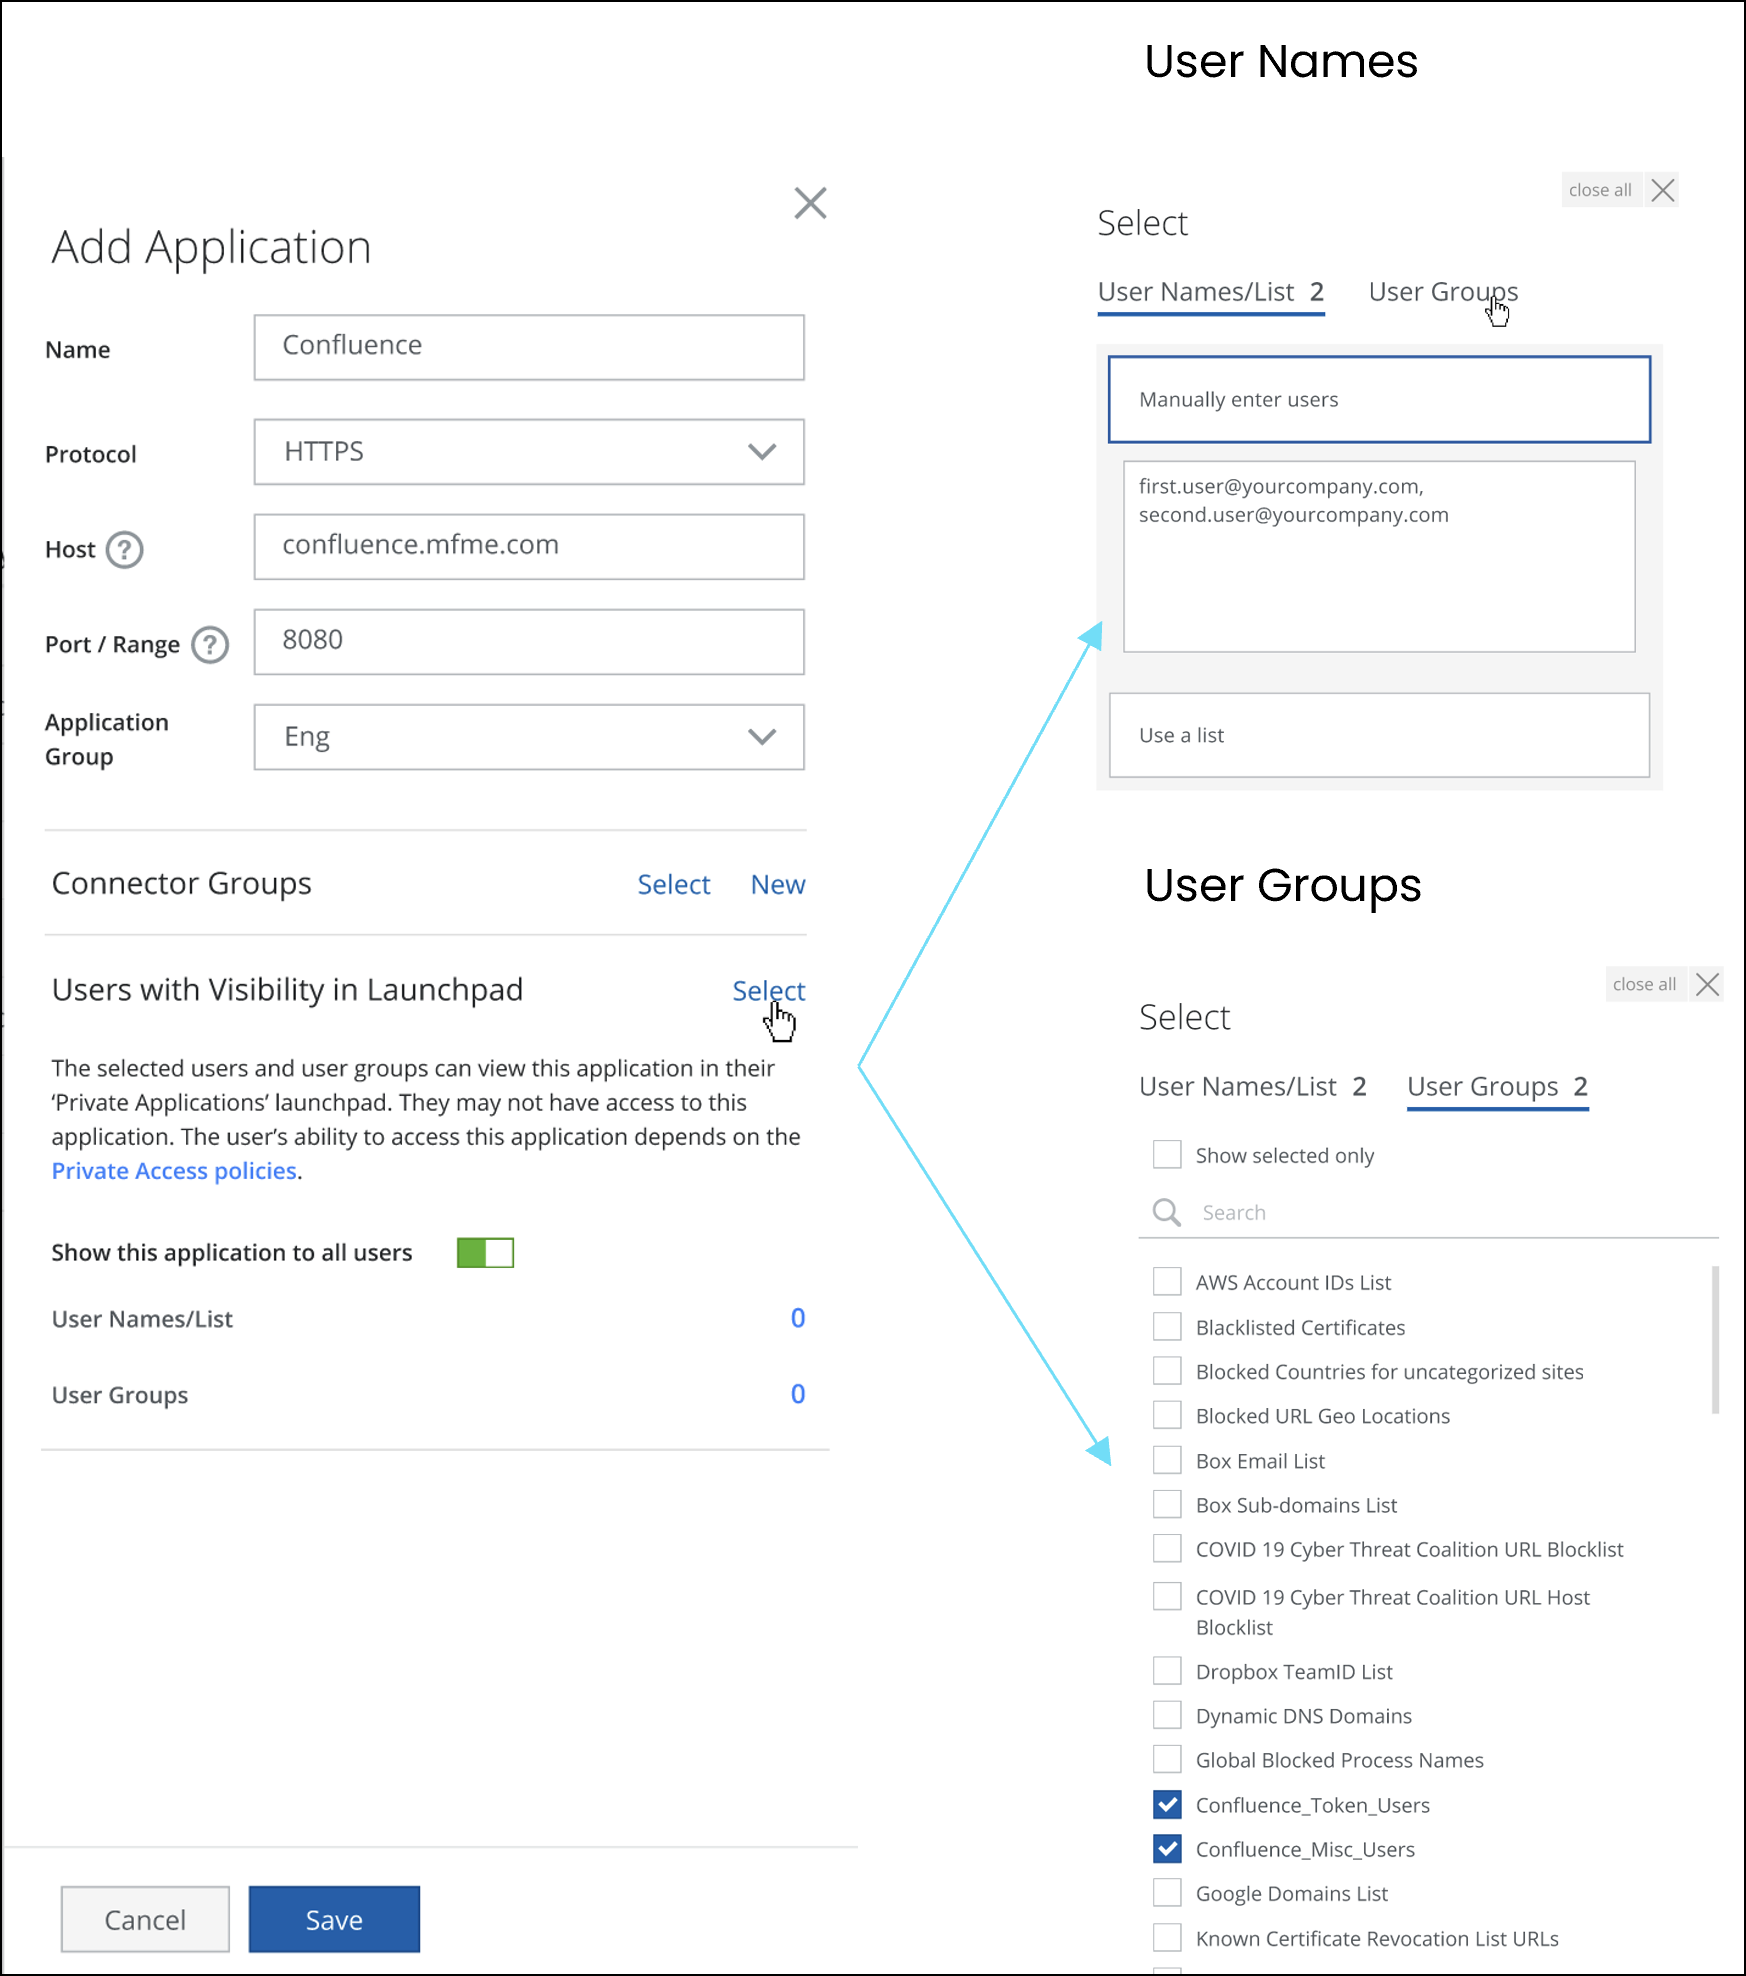
User-Specific Private Access Launchpad
You now have the option to view only users/user groups that have Private Application access permission in the Private Access launchpad. You can assign specific private applications to the desired users/user groups. Thus, instead of viewing all the Private Applications, you can view only the ones with access from the organization’s admin. After the authentication/login to the Private Access Launchpad, you can view only the private applications for which you have permission to access. For more details on User Launchpad, see Private Access User Launchpad
Support UDP-based applications
Private Access supports protocols such as HTTP, HTTPS, SSH, RDP, and Others(TCP). This is now being extended for full protocol support for UDP traffic of private apps. For more details, see UDP-based Private Applications
.png?revision=1)
Deploy Secure App Connector V2
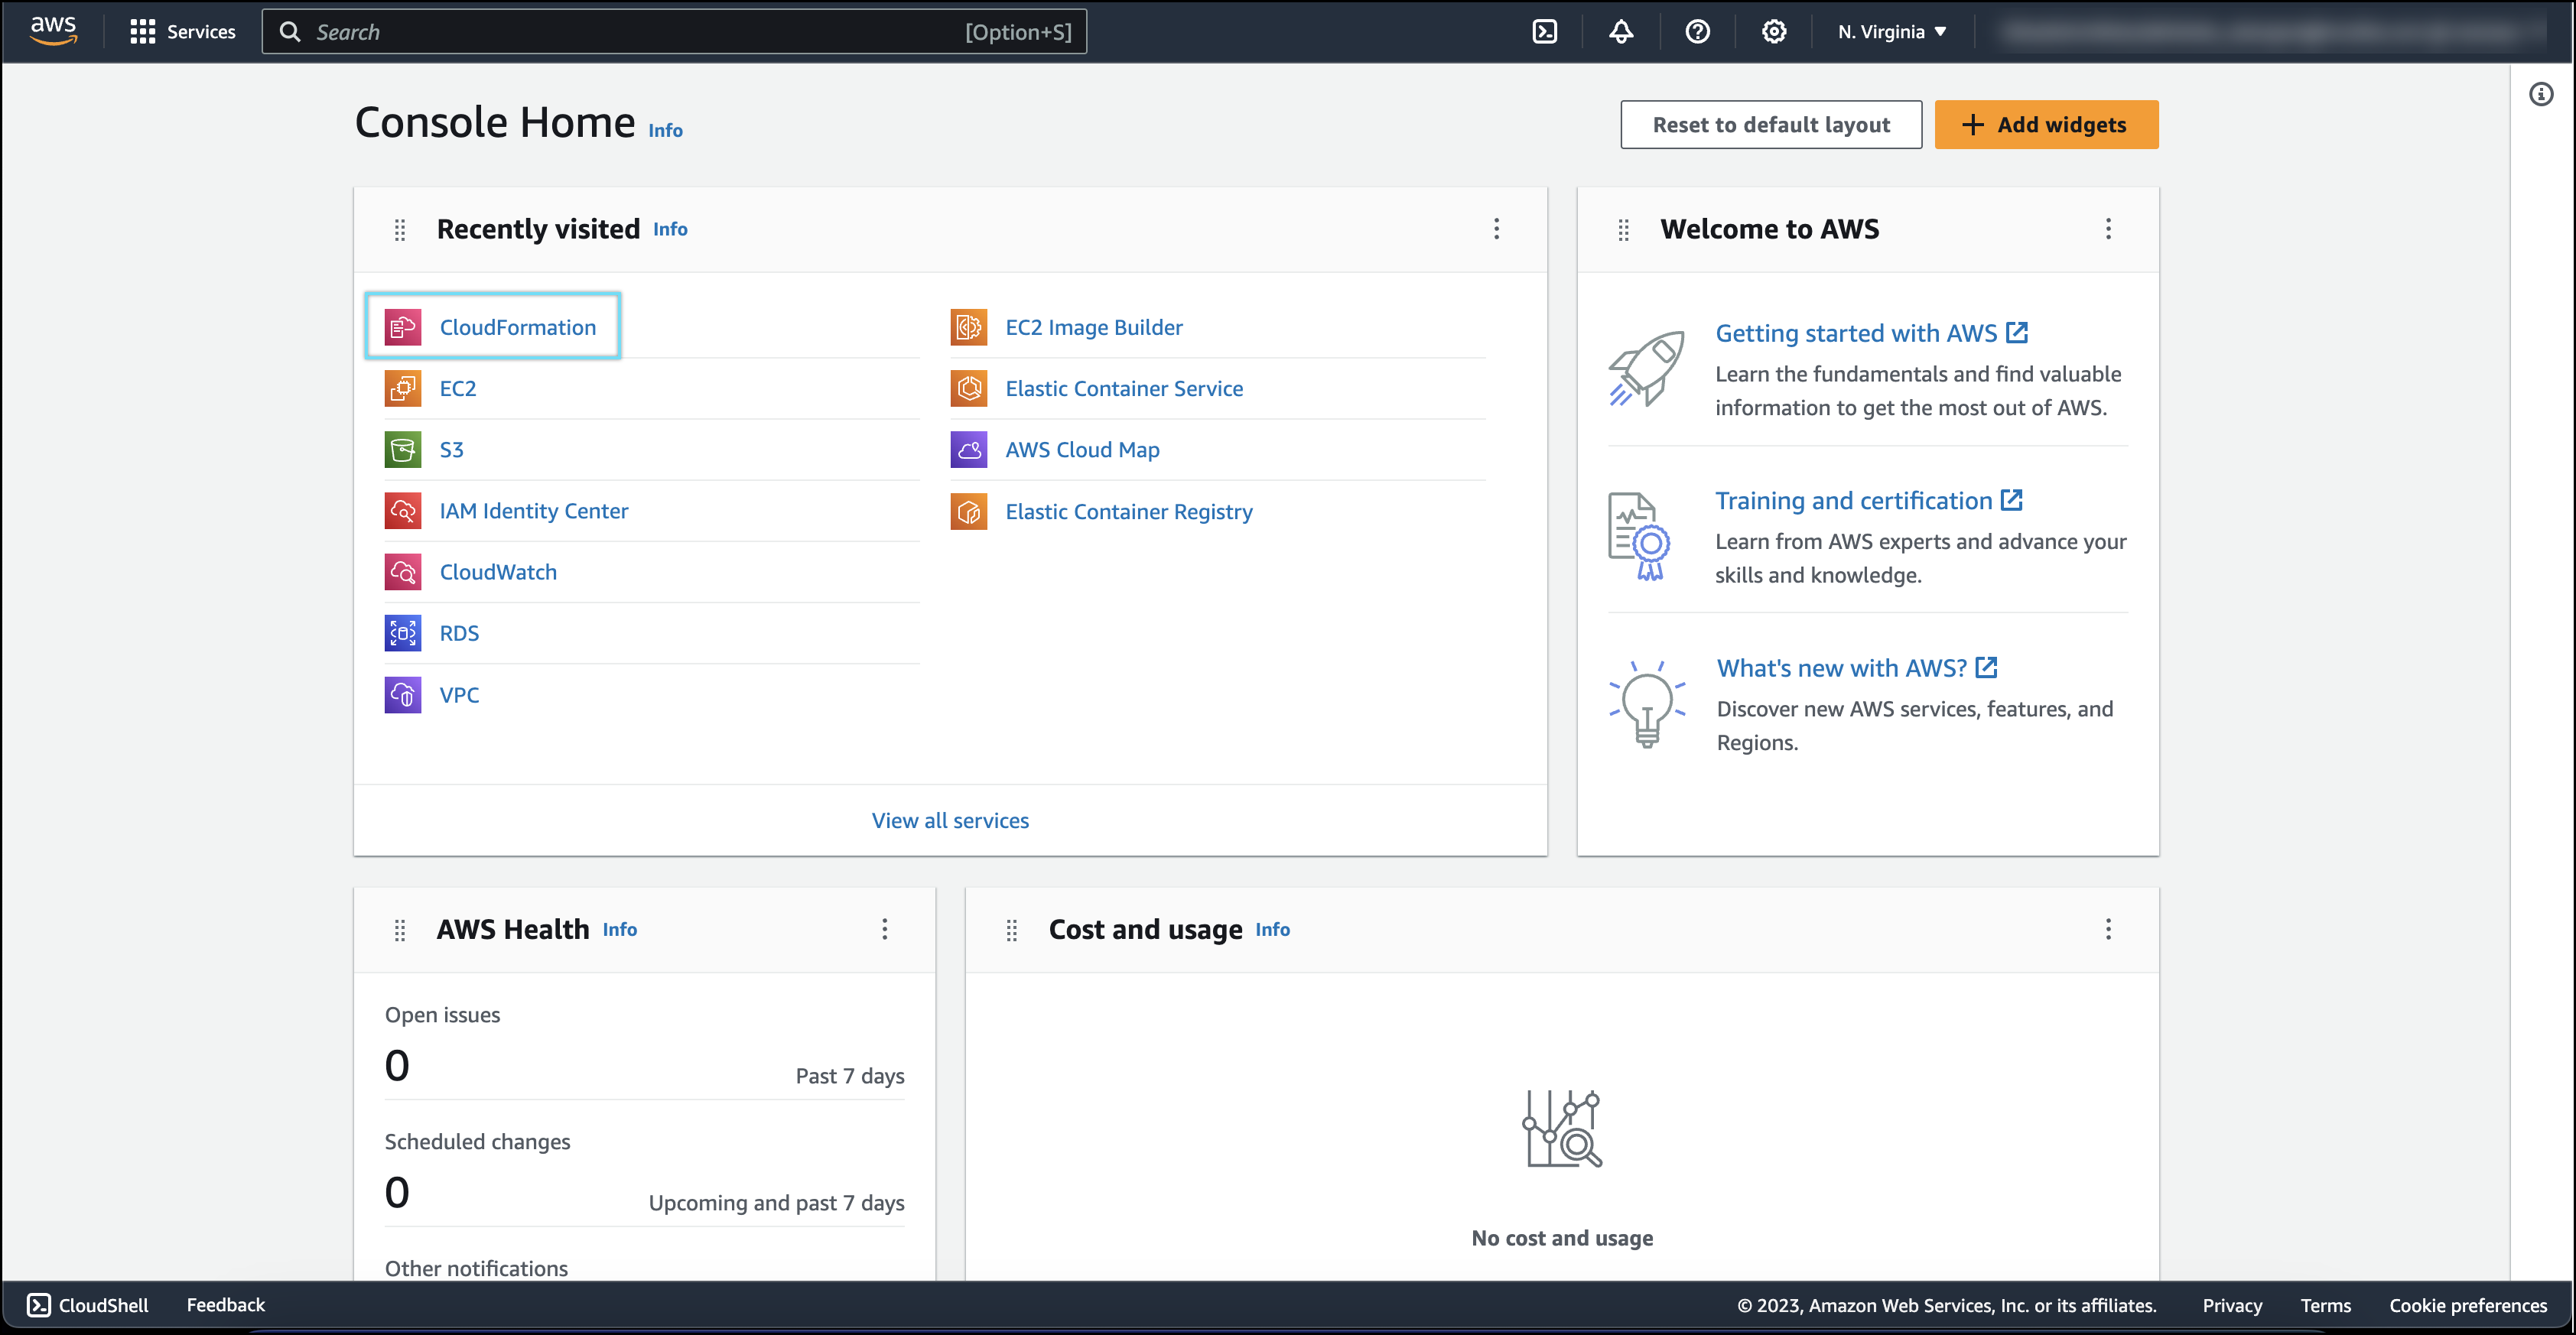
Using AMI Package
The Skyhigh connector group includes one or more Secure App Connectors, which enables end users to securely connect to their organization's private application via Skyhigh SSE. Secure App Connectors can be deployed in your Virtual Private Clouds (VPCs) for AWS. For deployment steps, see Secure App Connector V2 on AWS using CloudFormation Template
The OVA packages are available for the following environments:
- Secure App Connector V2 on AWS using CloudFormation Template
Skyhigh Cloud Firewall
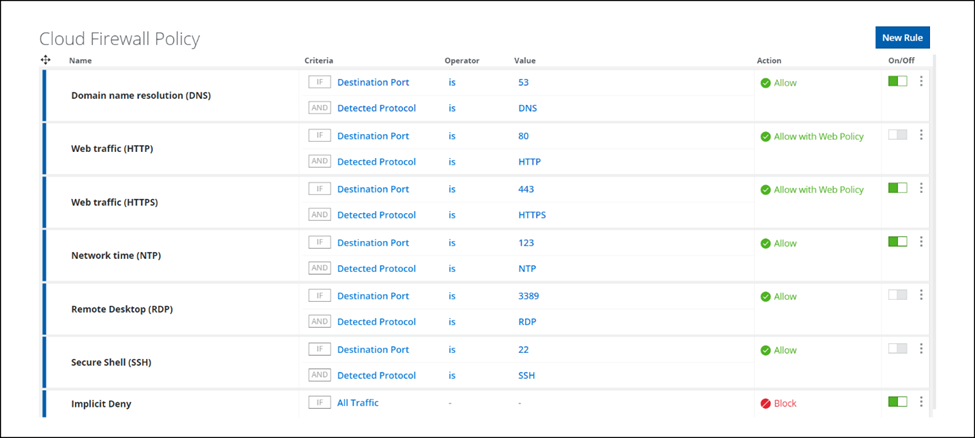
Default Cloud Firewall Policies
You now have the Default Policies available on the Cloud Firewall Policy page (found under Policy > Cloud Firewall > Policy). This makes it easier for the initial configuration of Cloud Firewall Policies especially for first time users. You can modify/delete/disable/enable these Default Policies on Cloud Firewall page based on the specific enterprise requirement. For details, see Configure Cloud Firewall Policy.
Skyhigh CASB
User Risk Score for Sanctioned Users on Threats and Anomalies
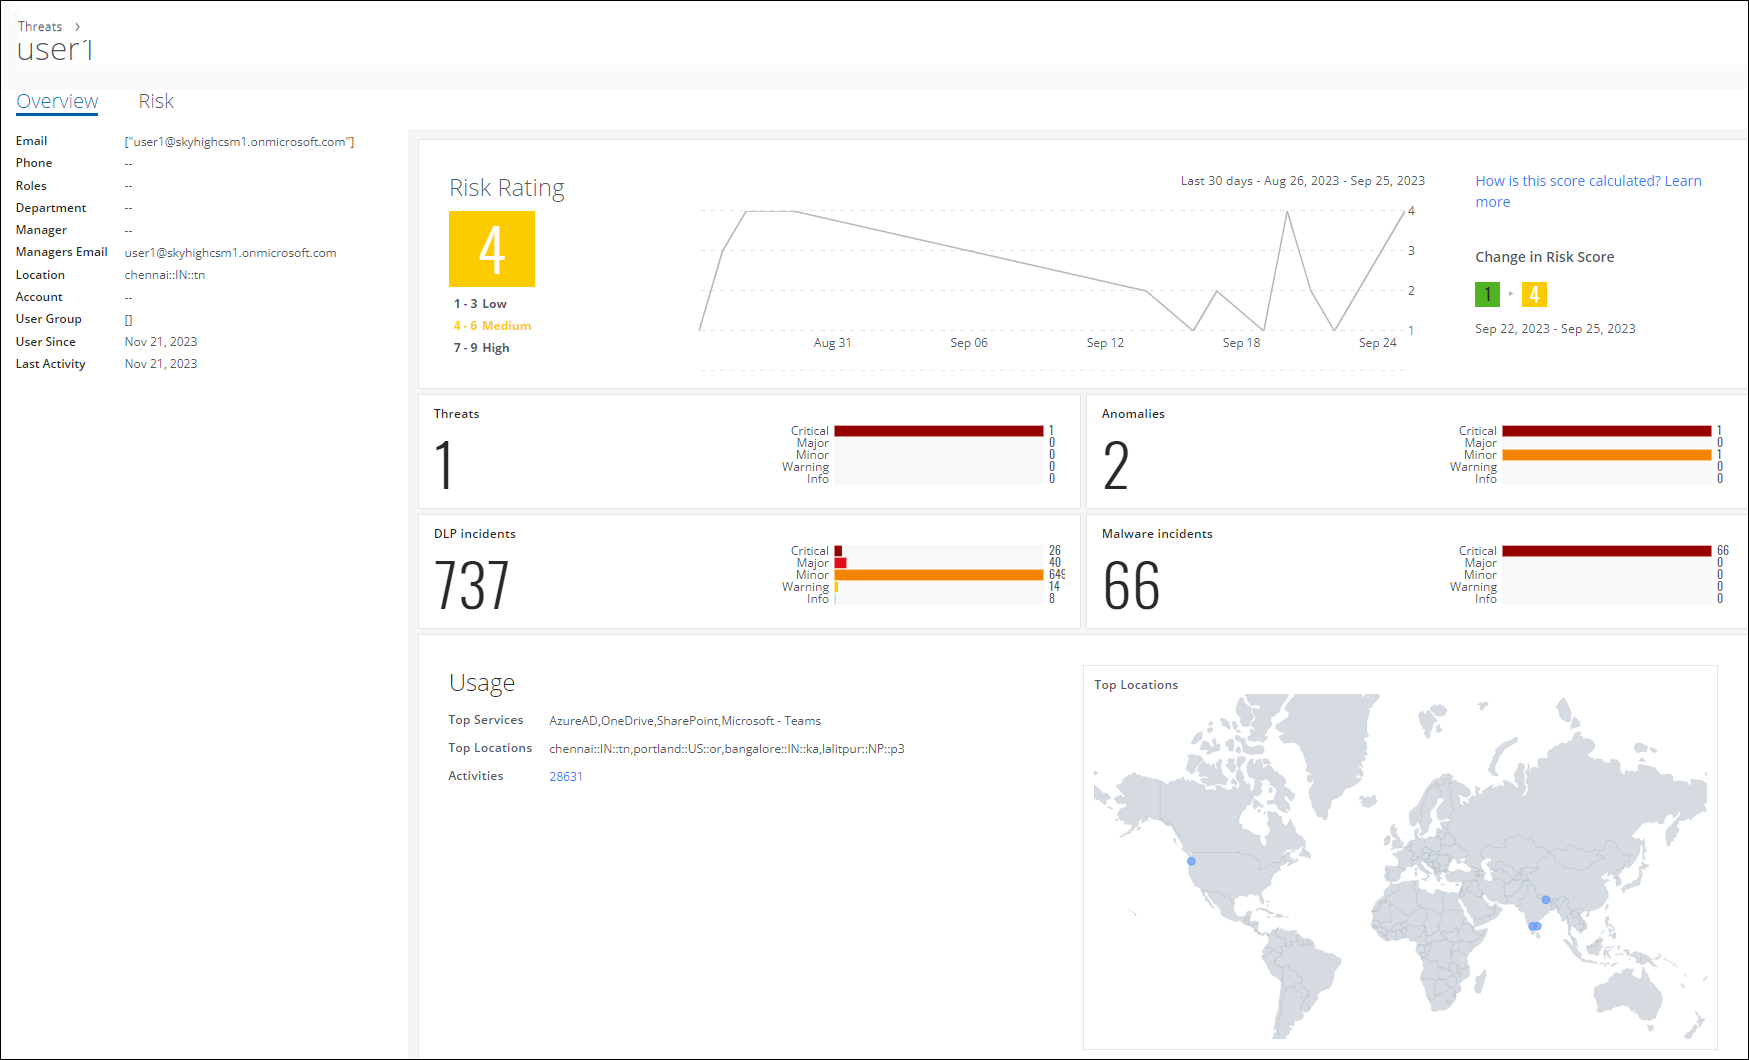
Skyhigh CASB allows sanctioned users to view their User Risk Score on the Threats (found under Incidents > Threats) and Anomalies (found under Incidents > Anomalies > Anomalies) pages. The risk score determines the level of risk that a user may pose to your organization's cloud services and data. By monitoring a user's typical usage patterns, you can quickly and accurately detect and track any changes that may indicate potential risks. This allows you to identify and address any security threats on time.
The User Risk Score is measured by identifying deviation in the user's regular behavior, differentiating from other users' behavior, and metadata about the user. The User Risk Score for each user is displayed based on threats, anomalies, incidents, and activities and is calculated using a weighted average of multiple attributes. For details, see User Risk Score on Threats and User Risk Score on Anomalies. You can monitor the trend and change in User Risk Score on the User Details Cloud Card on Threats and User Details Cloud Card on Anomalies pages.
NOTE: User Risk Score is displayed only for sanctioned CASB users. Skyhigh Security provides risk scores only for users who have been subjected to Skyhigh CASB analysis for at least seven days of network activity within the last 100 days.
Rebranding Changes
The tag name for Skyhigh SSE Web logs is renamed from McAfee WGCS to Skyhigh SSE Web.
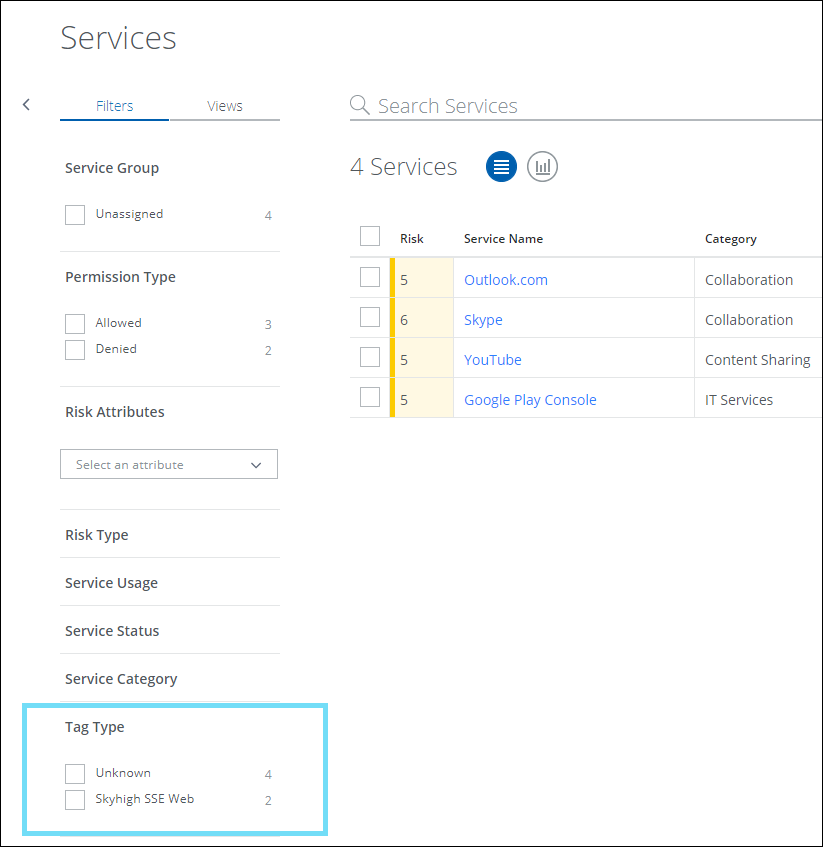
Shadow IT Services
On the Services (found under Analytics > Services) and Users (found under Analytics > Users) page, the Tag Type for Skyhigh SSE Web logs is renamed from McAfee WGCS to Skyhigh SSE Web.
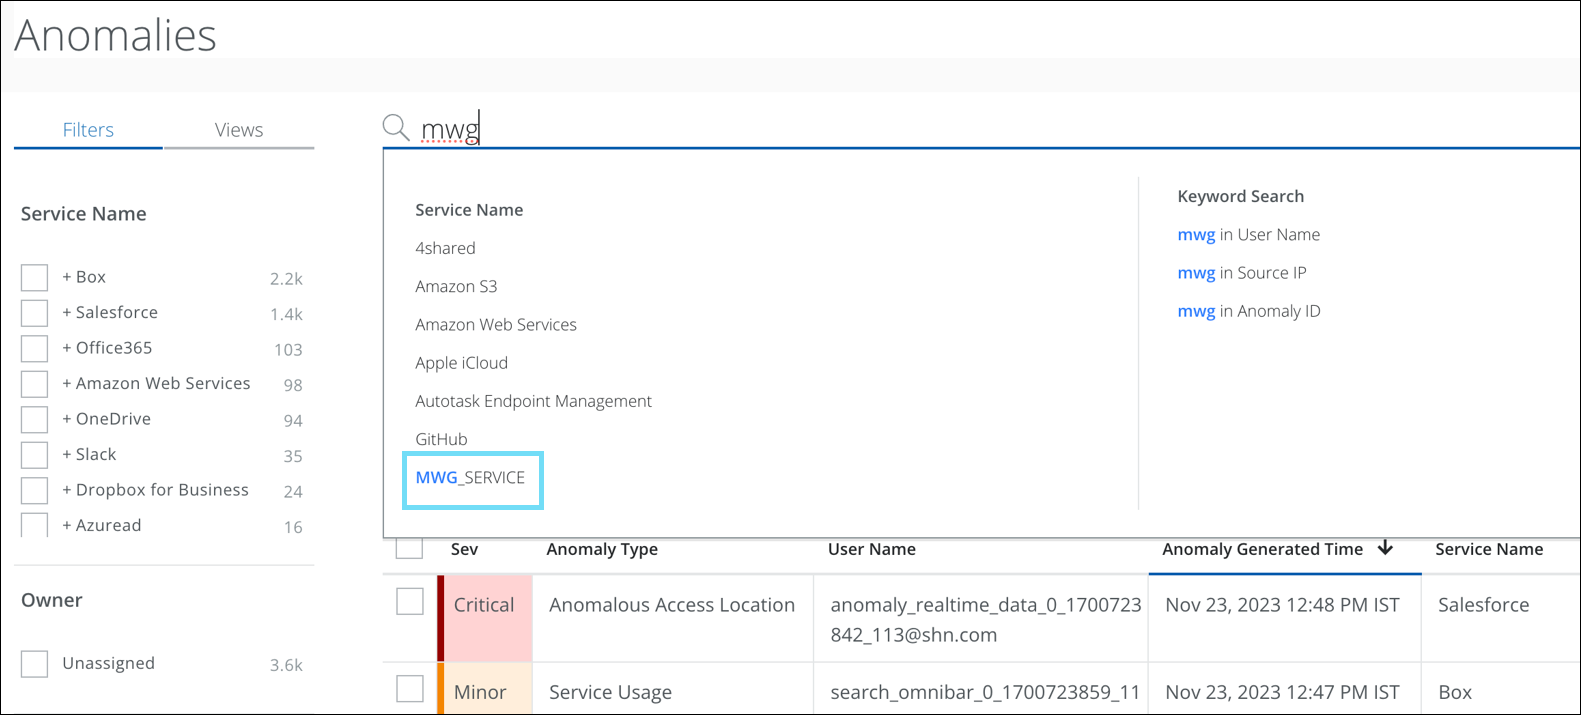
Sanctioned Services
On the Anomalies (found under Incidents >Anomalies > Anomalies) page, the tag name for Skyhigh SSE Web logs is renamed from MWG_SERVICE to SWG_SERVICE. On the Omnibar, use the SWG_SERVICE tag name to filter the Skyhigh SSE Web logs. However, to search the old Skyhigh SSE Web logs, use the MWG_SERVICE tag name.
- Use the SWG_SERVICE tag name to filter the latest data associated with Skyhigh SSE Web logs.
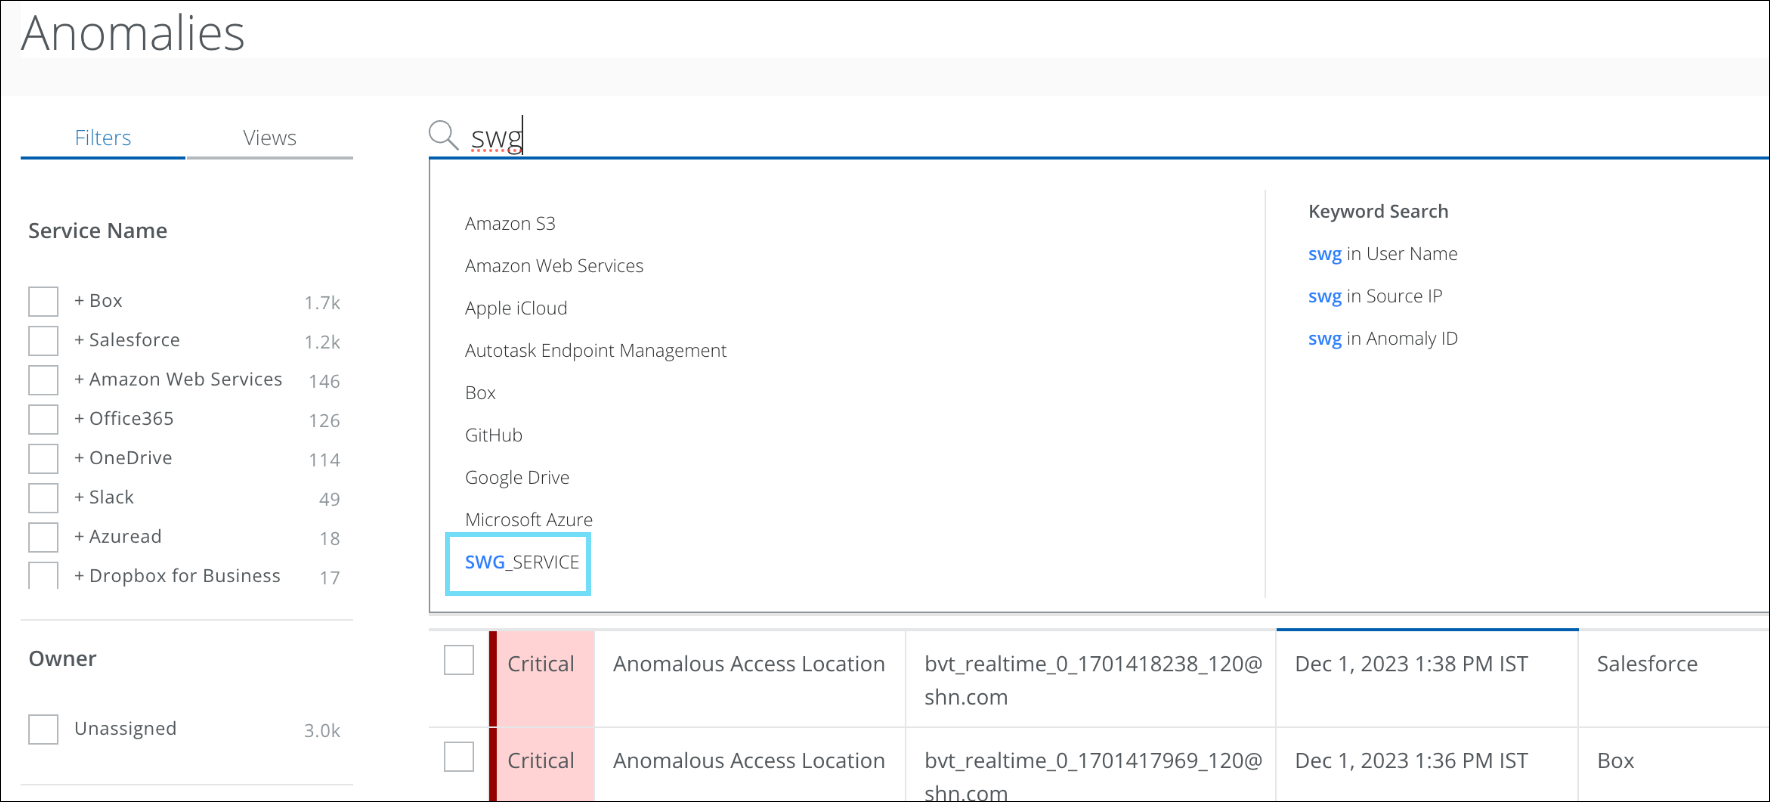
- Use the MWG_SERVICE tag name to filter the old data associated with Skyhigh SSE Web logs.
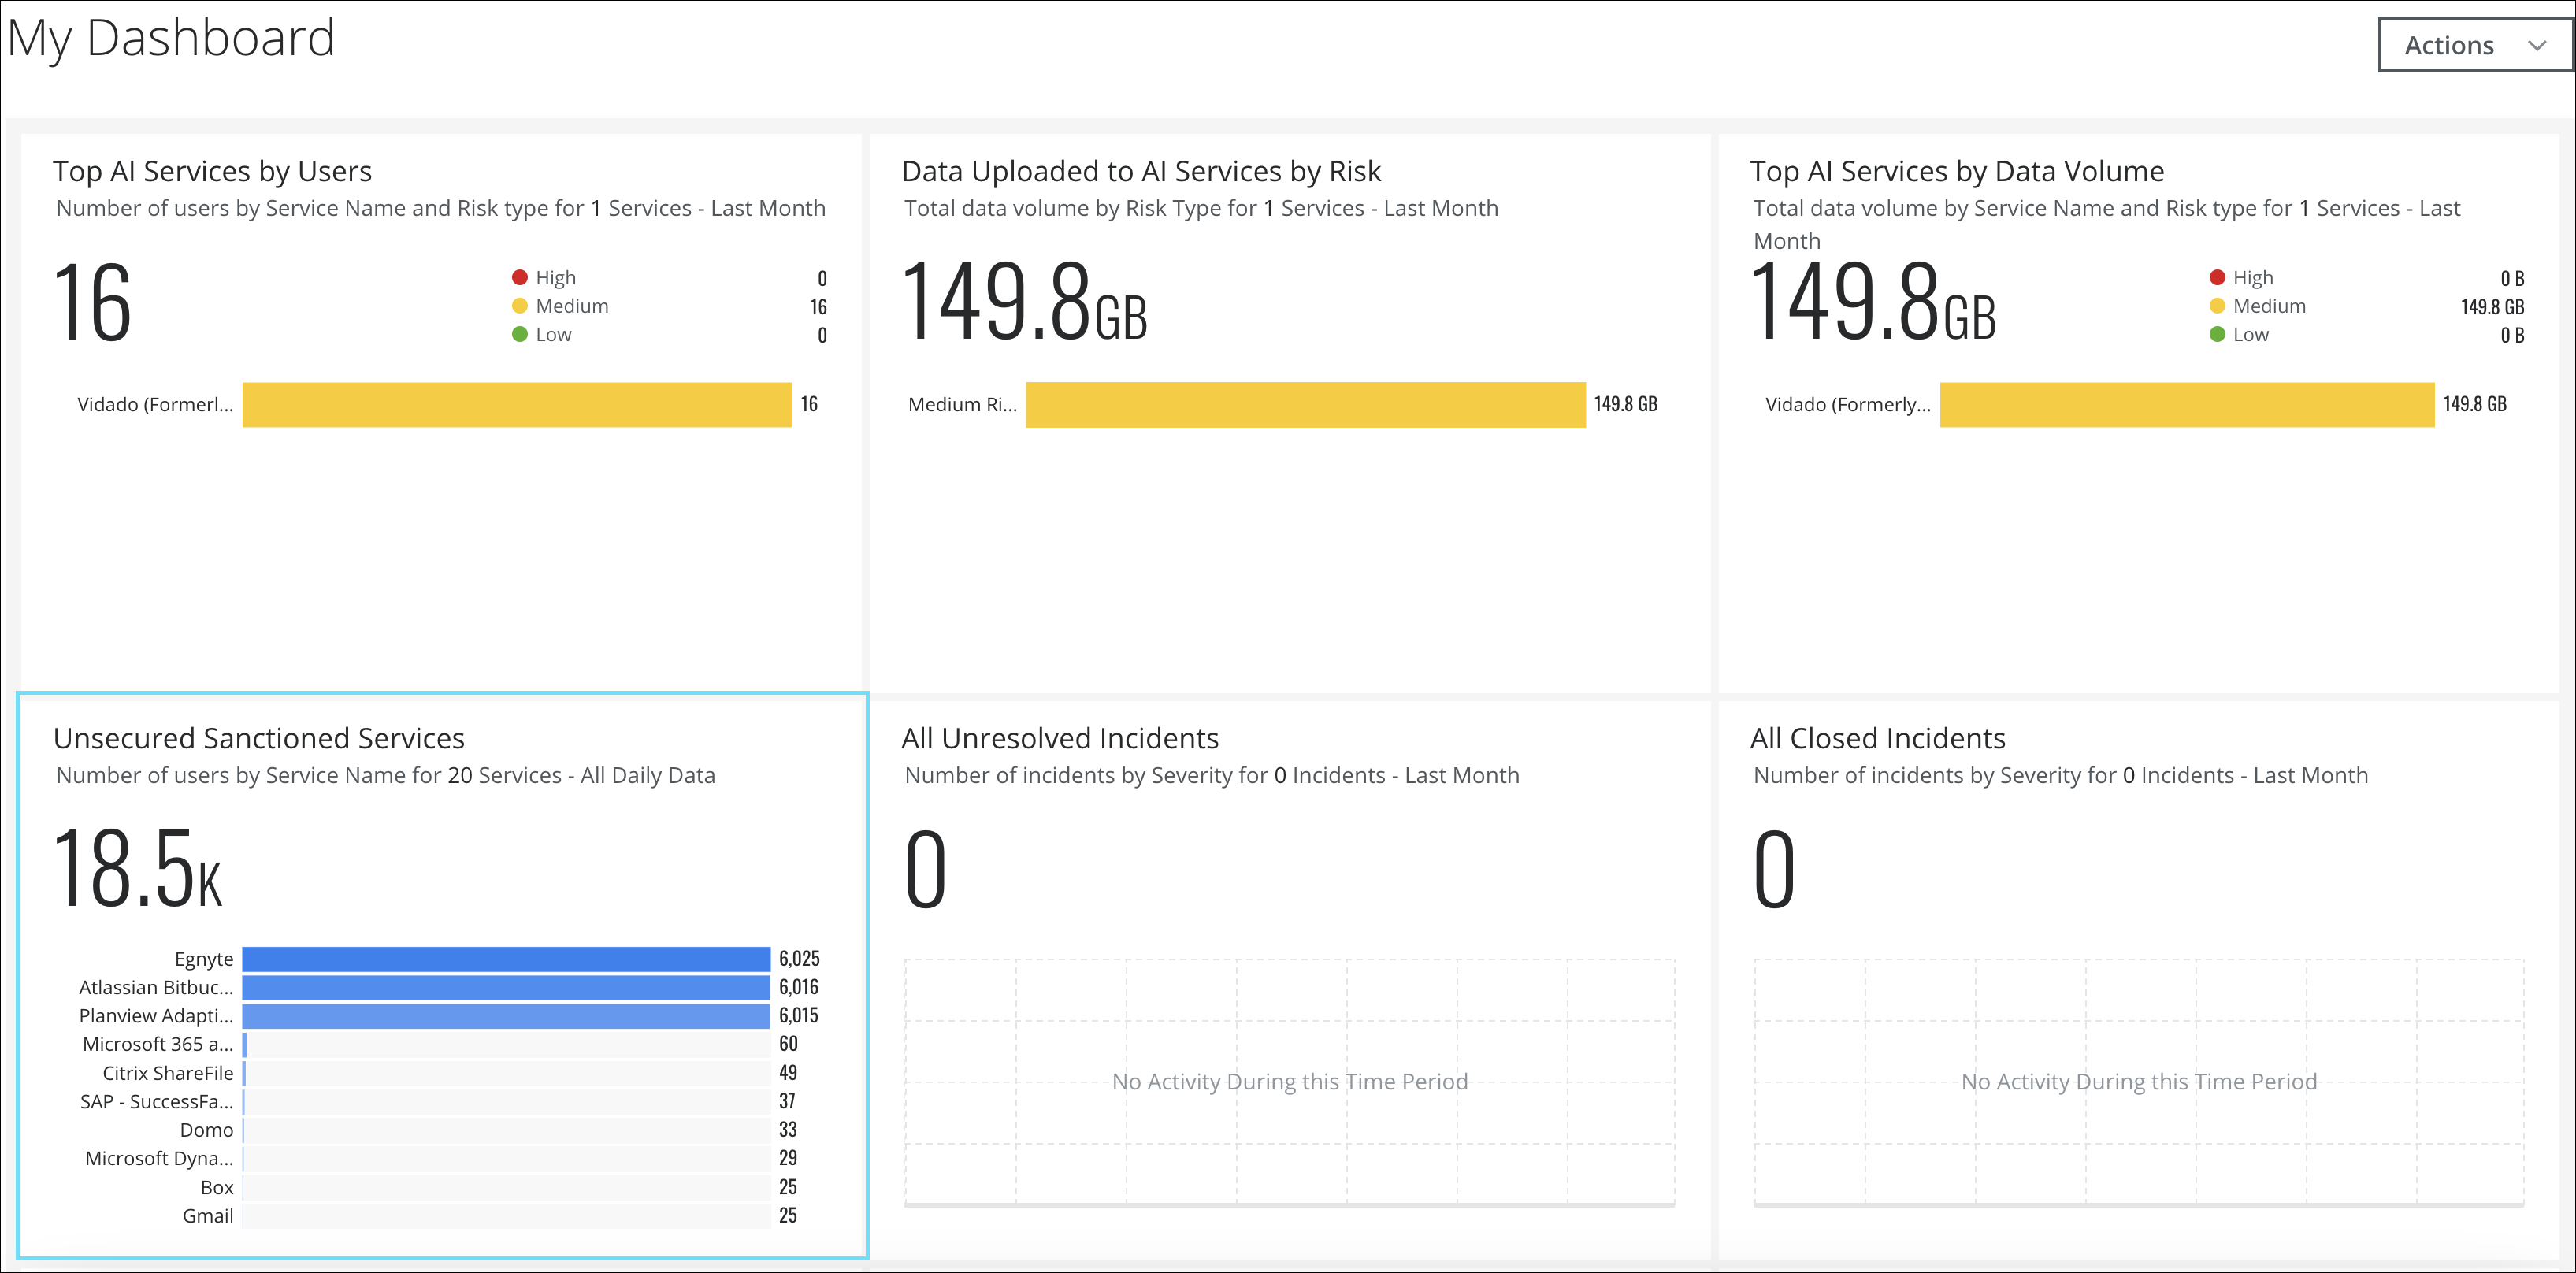
Dashboard Card for Sanctioned Services
Skyhigh CASB now includes a default dashboard card that provides real-time visibility into the volume of data associated with unsecured sanctioned cloud services used within your organization. This dashboard card displays the number of users for each top unsecured sanctioned cloud service, allowing you to track and monitor them. With this information, you can take remediation actions such as allowing or denying these services. For details, see Dashboard Card for Sanctioned Services.
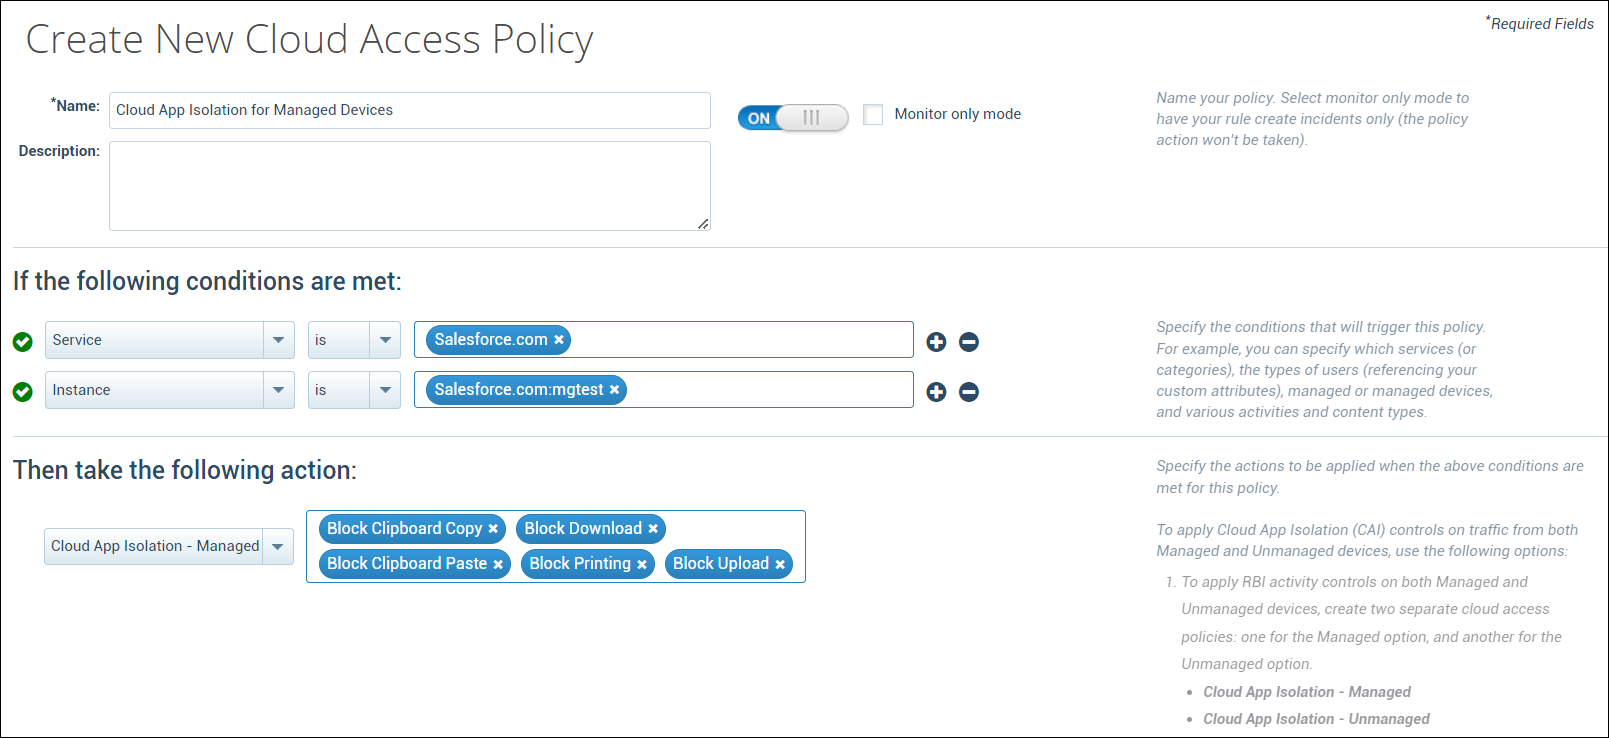
Support for Cloud App Isolation (Managed Devices)
Skyhigh CASB now provides support for traffic originating from managed devices via Cloud Application Isolation (CAI) controls. You can use the add-on SKU named Cloud App Isolation – Unmanaged Addon to apply CAI controls only on unmanaged devices, or the standalone SKU named Cloud App Isolation SKU (RP-RBI Managed) to apply CAI controls on both managed and unmanaged devices. For details, see Cloud Activity Controls with CAI.
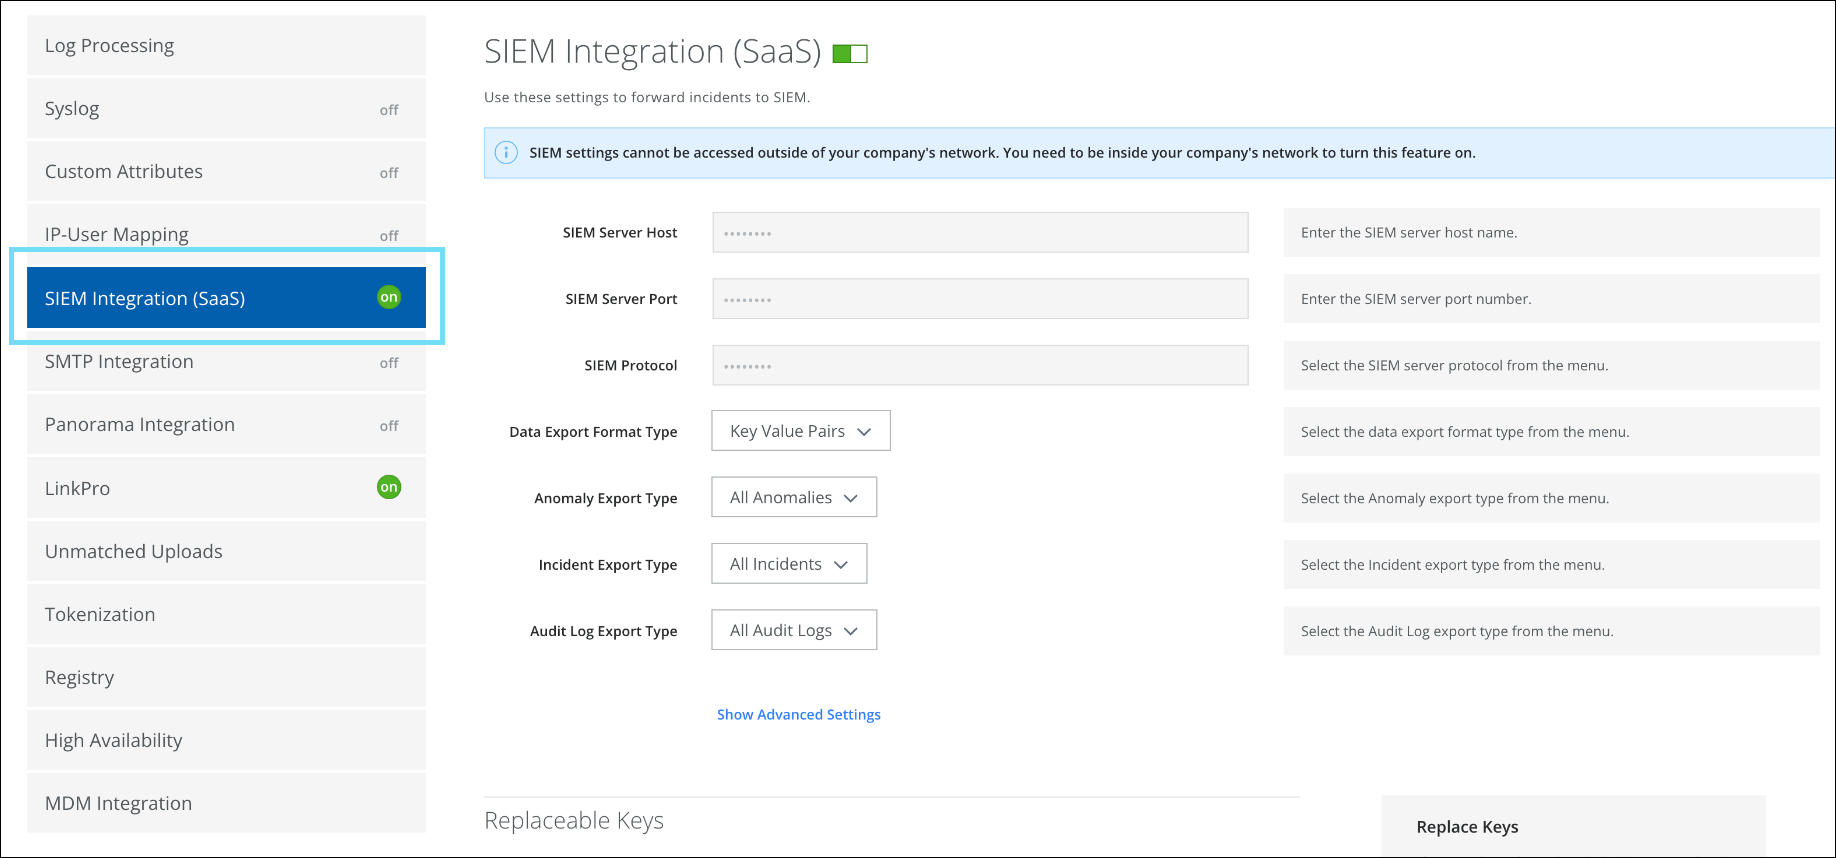
SIEM Integration Renamed to SIEM Integration (SaaS)
On the Cloud Connector Configuration (found under Settings > Infrastructure > Cloud Connector) page, the SIEM Integration tab is renamed to SIEM Integration (SaaS). The functionality remains unchanged. Use SIEM Integration (SaaS) to export anomalies, threats, incidents, and audit logs from Skyhigh CASB to your third-party SIEM systems (Security Information and Event management).
NOTE: Currently, the updated tab name is made available only to a few Skyhigh Security Cloud Connector users. However, it will be available to all the Skyhigh Security Cloud Connector users from the next release.
Resolved and Known Issues
 Click here to view Resolved and Known Issues
- For details, see Skyhigh Security Cloud Bug Fixes and Known Issues.